The 3 Indicators and What Each One Actually Does
This is a manual, three-indicator confluence method built for MetaTrader 4 (MT4). The idea is simple: no single tool tells the whole story, so we stack a signal tool, a momentum tool, and a trend tool and only act when they agree. Each one answers a different question.
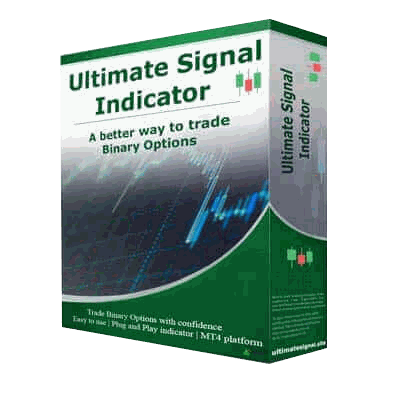
Ultimate Signal Indicator
Plots buy and sell arrows and alerts as a potential entry cue. Treat it as a prompt to check the other two tools, not as a standalone command to trade.Ultimate Stoch Oscillator
Measures momentum and highlights overbought and oversold conditions, which can hint at a stall, a reversal, or a continuation of the current move.Ultimate Trend Indicator
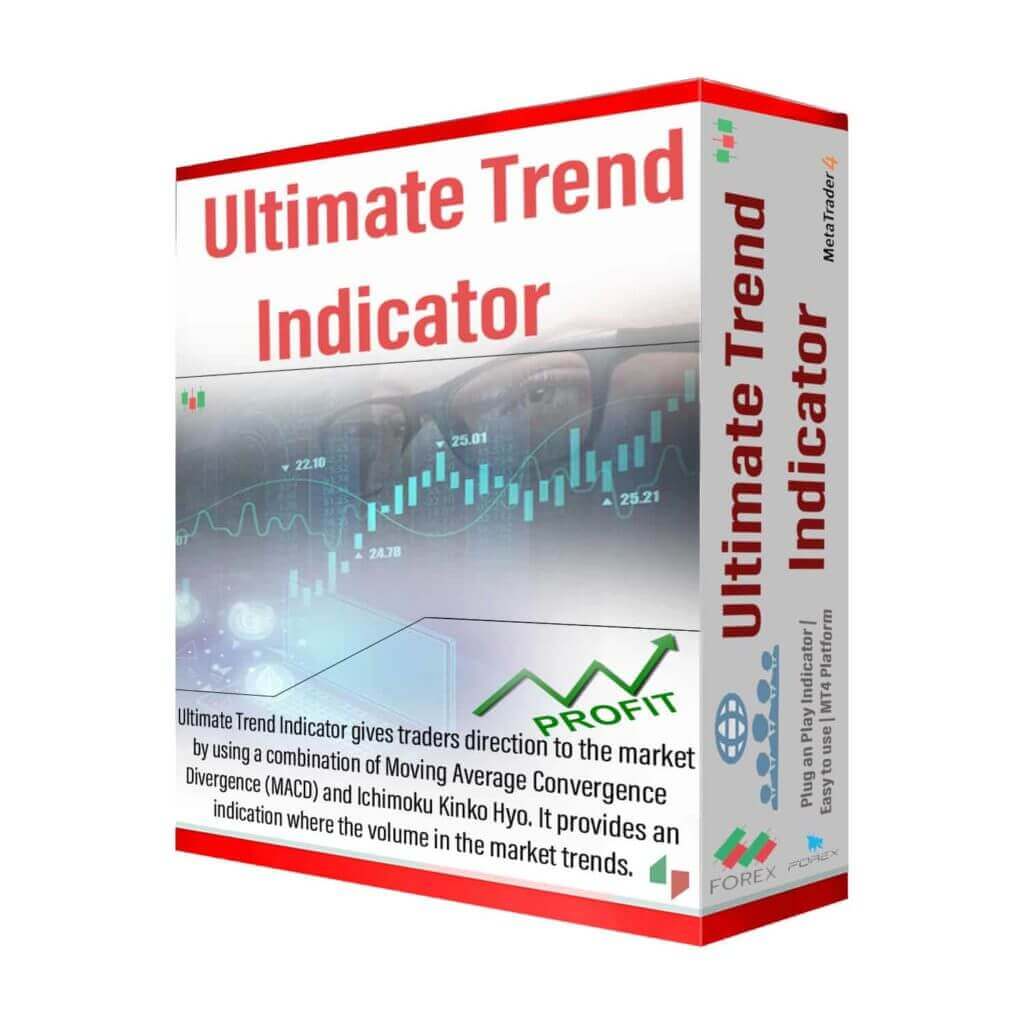
Tracks the broader direction and nearby support and resistance so you can tell whether a signal is trading with the trend or against it.
How the Confluence Works
Confluence means several independent signals lining up in the same direction. One tool can be noisy; three tools agreeing is a stronger reason to look at a setup. A typical read on the chart goes like this:
- Wait for the Signal Indicator arrow to fire.
- Confirm the Trend Indicator agrees with the arrow's direction — skip signals that fight the trend.
- Check that the Stoch Oscillator supports the move rather than sitting at an exhausted extreme against you.
- Only when all three align do you consider an entry.
The method is designed for lower timeframes such as the 1-minute and 3-minute charts. Faster charts mean more setups but also more noise, so patience and selectivity matter more than the number of trades you take. If alerts stop coming through for an hour or more, restart MT4 or switch the server address in your terminal.

Realistic Expectations
Confluence filters out some weak setups, but it does not remove losing trades — no indicator or combination can. Fewer, higher-quality entries is the goal, not a perfect record. Test the approach on a demo account until the reading feels natural, and keep a simple log of what worked so you can refine the rules for the pairs and sessions you actually trade. If you want the full toolset, all three indicators are included with our $39 lifetime bundle alongside 100+ other tools.
Risk Management
Rules matter more than any single indicator. A few basics keep a normal losing streak from turning into a blown account:
- Risk only a small, fixed percentage of your balance per trade so no one result can hurt you badly.
- Set a hard per-session loss cap and stop for the day once you hit it.
- Avoid the Martingale method. Raising your stake after a loss is not money management. Each trade is independent, so a bigger stake never improves the next outcome — a normal losing run simply makes the required stake exceed your balance and empties the account. Use fixed-fractional staking instead.
- Filter signals and skip setups where the three tools disagree; watch for reversal cues such as red bars on the oscillator before committing.
FAQ
Does this strategy win every trade?
No. No indicator combination wins every trade. Confluence is meant to help you skip weaker setups and focus on cleaner ones, but losses are a normal part of trading and you should size every position so a loss is survivable.
Which timeframe should I use?
The setup is built for the 1-minute and 3-minute charts. Beginners often find the 3-minute chart easier because it moves a little slower and gives more time to confirm all three tools before acting.
Do I need all three indicators?
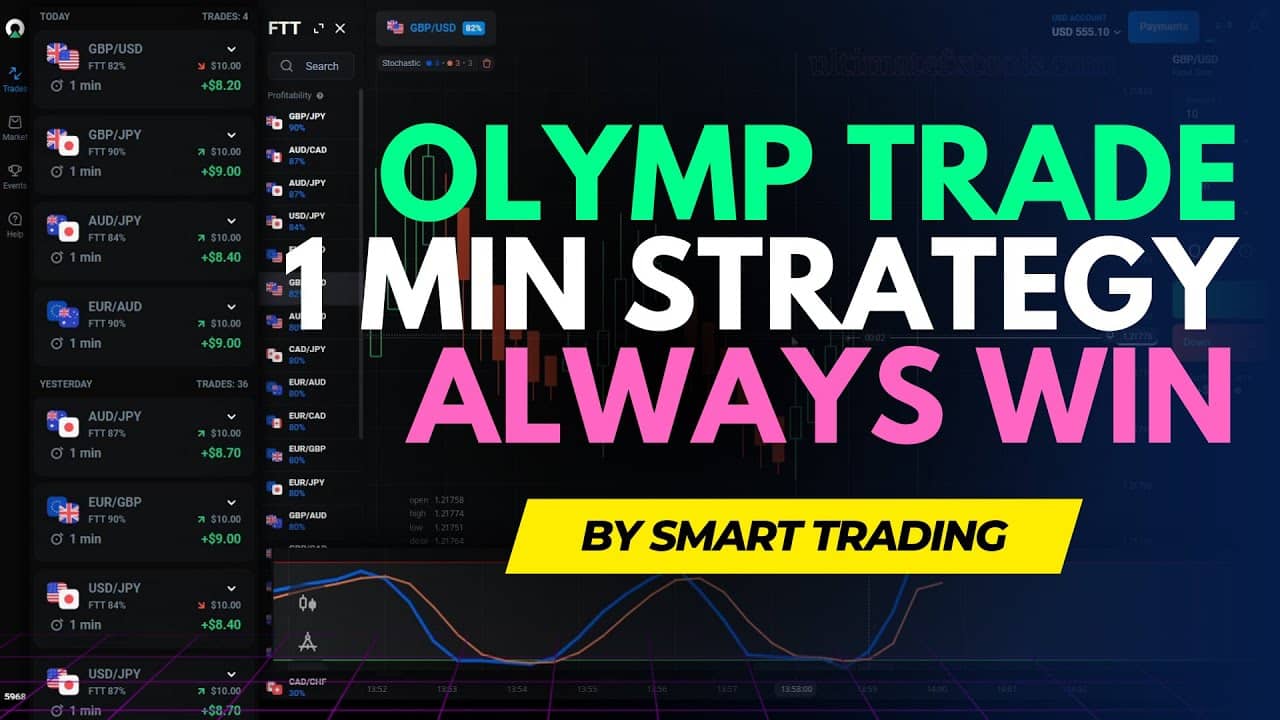
The whole point is confluence, so yes — using all three is what filters out signals that look good in isolation but conflict with the trend or momentum. If you want to see how these ideas apply to a shorter setup, see our Olymp Trade 1-minute strategy.
This content is for educational purposes only and is not financial advice. Trading involves substantial risk; you can lose some or all of your capital. No result is guaranteed and past performance does not indicate future results. Trade only what you can afford to lose.