Best Forex Indicators: What Each One Actually Measures
Search for the “best forex indicators” and you will find dozens of lists that all disagree. That is the first clue: there is no single best indicator in the abstract. An indicator is a formula applied to price, and each one measures just one thing — trend direction, momentum, volatility, or volume. The tool that suits a quiet ranging session is rarely the one that suits a fast trending open. So the useful question is not “which indicator is best” but “which measurement do I need right now, and which tool reads it clearly.” Below are the main categories worth knowing, what each is built to show, and how to combine them without fooling yourself.
1. Moving Averages — Trend
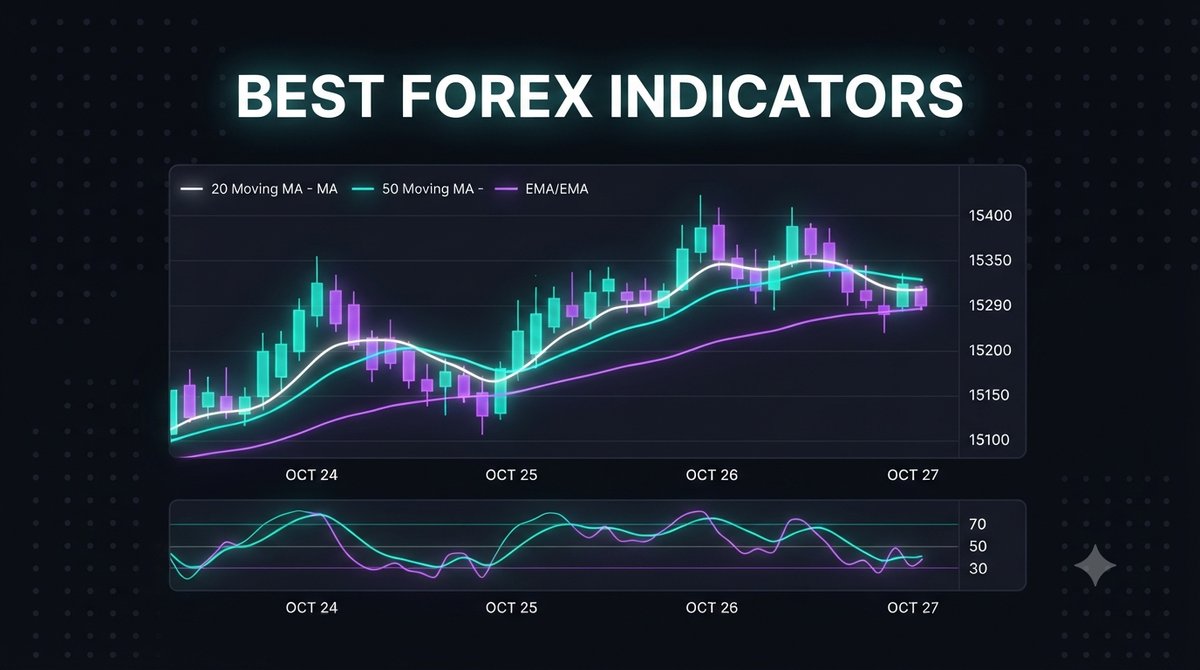
A moving average smooths price into a single line so the underlying direction is easier to see. A shorter average (for example a 20-period) hugs price and reacts quickly; a longer one (50 or 200) is slower but steadier. Traders watch the slope of the line and whether price sits above or below it to gauge whether a market is trending up, down, or drifting sideways. Crossovers between a fast and slow average are a classic way to flag a possible shift in direction. Moving averages lag by design — they describe what price has already done — so they read trend well but warn you late at turning points.
2. RSI and Stochastic — Momentum
Momentum oscillators measure the speed of a move rather than its direction. The Relative Strength Index (RSI) and the Stochastic oscillator both swing between 0 and 100 and flag when a market looks stretched — often called overbought or oversold. Just as useful is divergence: when price makes a new high but the oscillator does not, momentum may be fading beneath the surface. Treat these as context, not signals on their own; a strong trend can stay “overbought” far longer than feels reasonable. Our Ultimate RSI Bars and Ultimate Stoch Oscillator pages walk through reading these two in more detail.
3. Bollinger Bands and ATR — Volatility
Volatility tools measure how much price is moving, not where it is heading. Bollinger Bands wrap a moving average in an upper and lower band that widen when the market is active and contract when it goes quiet — a squeeze often precedes a bigger move, though it does not tell you the direction. Average True Range (ATR) puts a single number on recent range, which is genuinely useful for sizing a stop or a target to current conditions rather than a fixed guess. See the Bollinger MA guide for how the bands and a moving average work together.
4. MACD — Trend and Momentum Together
MACD (Moving Average Convergence Divergence) is built from two moving averages plus a histogram, so it blends trend and momentum in one panel. The histogram expanding shows momentum building in the trend's direction; contracting or crossing the zero line hints the move is losing steam. Because it is derived from averages, MACD shares their lag, but many traders like it as a single confirmation filter. The MACD trend detector post shows one way to apply it.
How to Combine Indicators Without Fooling Yourself
The most common mistake is stacking three tools that all measure the same thing. Two moving averages and a MACD are all trend-and-average based, so when they “agree” they are really just repeating one reading in three colours — that is confirmation bias, not confirmation. Real confirmation comes from pairing indicators from different families: a trend tool with a momentum oscillator, or a momentum reading checked against volatility. A practical starting point is one trend indicator to define direction, one momentum indicator for timing, and volatility to size your risk. Keep the chart uncluttered; three well-chosen tools you understand beat eight you half-read under pressure. Whatever mix you settle on, test it on a demo account first and keep firm risk management — a fixed, small stake per trade and a daily stop — because no indicator removes losing trades. You can browse the full set of trading indicators and try the combinations that fit your style.
FAQ
What is the single best forex indicator?
There isn't one. Each indicator measures a different property of price — trend, momentum, volatility, or volume — and each suits different conditions. The “best” setup is the smallest combination that answers the questions you actually need answered, used with consistent risk management.
How many indicators should I put on a chart?
Usually two or three is plenty, as long as they come from different families. Adding more tools that measure the same thing does not add information — it just crowds the chart and creates a false sense of agreement. Start simple and add only when a tool earns its place in testing.
Are these indicators free, and what does the paid plan include?
The educational explainers on this site are free to read. The downloadable indicator tools for MetaTrader 4 and MT5 are bundled together under a single lifetime $39 plan, so you can test the different categories rather than buying each one separately.
This content is for educational purposes only. Trading involves risk. Past results do not guarantee future outcomes. Always practice responsible money management and limit your daily trades to avoid large losses.