Trading Binary Options Without Indicators
Trading without indicators means reading the raw chart itself instead of layering moving averages, oscillators, or arrow tools on top of price. This approach is usually called price action or "naked chart" trading. The appeal is straightforward: indicators are calculated from past prices, so they always lag a little behind what the market is doing right now. By watching price directly, you react to the current candle rather than to a smoothed version of it. That said, reading price action is not easier or more certain than using indicators. It removes the lag but replaces it with subjectivity, and it takes real screen time to develop. This guide covers what a naked-chart approach involves, where it has genuine merit, and where it tends to fail.
Support and Resistance: The Core of Price Action
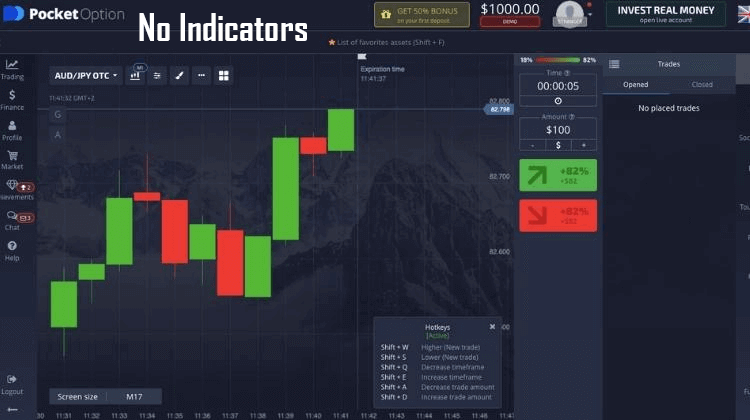
The foundation of naked-chart trading is support and resistance. Support is a price zone where buyers have repeatedly stepped in and pushed price back up; resistance is a zone where sellers have repeatedly capped a move. These levels matter because other traders see them too, so price often reacts around them. To define a level, look left on the chart and mark the areas where price turned more than once. Treat them as zones, not exact lines, because price rarely respects a level to the pip. The more times a level has been tested and held, the more traders are watching it, though heavily tested levels can also break when pressure builds behind them.
Key Candlestick Signals
Candlestick patterns are the second half of a naked-chart read. They are most useful when they form at a level you have already marked, not in the middle of nowhere. A few of the most reliable to learn first:
- Pin bar / rejection candle: a candle with a long wick and small body, showing price was pushed into a level and rejected. A long lower wick at support hints at buyers defending it; a long upper wick at resistance hints at sellers.
- Engulfing candle: a candle whose body fully covers the previous one, signalling a shift in short-term control from buyers to sellers or the reverse.
- Inside bar: a small candle contained within the prior candle's range, showing the market pausing and compressing before its next move.
Reading market structure ties these together: a series of higher highs and higher lows is an uptrend, lower highs and lower lows a downtrend, and a flat, overlapping range is indecision where signals are least reliable.
A Simple No-Indicator Workflow
Here is a calm, repeatable way to apply the method on a short binary expiry:
- Mark two or three clear support and resistance zones on your chosen pair before you look for any trade.
- Wait for price to reach one of those zones rather than trading in the empty middle of the range.
- Watch for a candlestick signal at the zone that agrees with the direction the level suggests.
- Decide your call or put only when the level and the candle point the same way; stand aside when they do not.
For a deeper look at reading turns in price, see our walkthrough on how to find reversals in binary options and this critical reversal strategy. If you prefer trading levels as they give way rather than hold, the trending breakout method shows the opposite side of the same idea.
When Price Action Fails
Naked-chart trading is subjective, and two traders can read the same chart differently. Levels break, pin bars fail, and low-volume or news-driven conditions can void a clean-looking setup in seconds. Because there is no indicator giving a fixed yes or no, discipline has to come from you. That makes risk management the deciding factor, not the signal. Stake a small, fixed fraction of your balance per trade, cap how many trades you take in a session, and stop for the day at a preset loss limit. Practise the whole workflow on a demo account until the reads feel natural before committing real funds, and remember that removing indicators does not remove losing trades. If you would rather have tools plot levels and signals for you, the indicator library on our $39 lifetime plan is one alternative to a purely manual approach.
FAQ
Is trading without indicators easier than using them?
No. It removes indicator lag, but it replaces that with subjective judgement that takes practice to build. Price action reading trades one trade-off for another rather than being a shortcut. Both approaches still produce losing trades.
Do I need any tools at all for this method?
Only a clean chart with candlesticks. Some traders keep it fully manual, while others prefer indicators that mark levels or signals automatically. If you want that option, the tools on our $39 lifetime plan cover MT4 and MT5, but a bare chart is enough to start learning.
What timeframe suits a naked-chart approach?
Beginners often find higher timeframes easier because levels are clearer and there is more time to decide. Very short expiries move fast and leave little room to read a candle before it closes, so build the skill on slower charts first.
This content is for educational purposes only. Trading involves risk. Past results do not guarantee future outcomes. Always practice responsible money management and limit your daily trades to avoid large losses.