ATR Trading Indicator - IQ Option Advance Trading Method
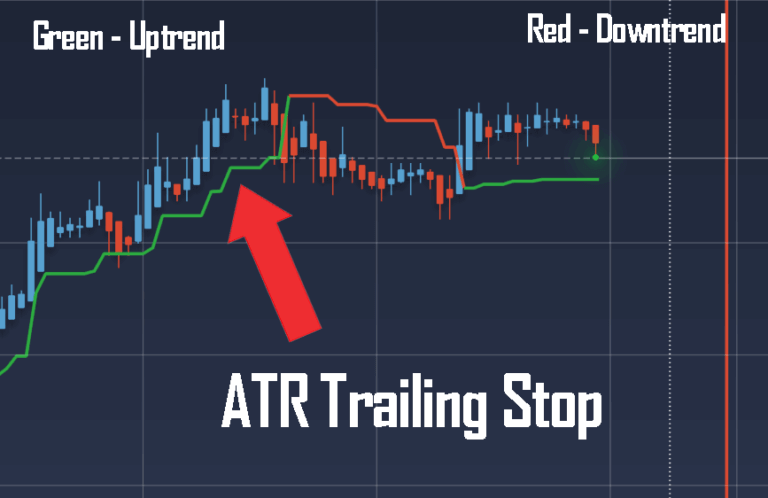
The Average True Range (ATR) is a volatility indicator developed by J. Welles Wilder. It measures how much an asset typically moves over a given period by averaging the "true range" of recent candles. The version shown here is an ATR Trailing Stop, which plots a line above or below price that trails the market as it moves. It is a practical way to visualise how far price is swinging and where a volatility-based stop might sit.
The most important thing to understand up front: ATR does not predict direction. It tells you how much a market is moving, not which way it is going. A rising ATR means the range is expanding (more volatile); a falling ATR means the market is quieting down. Because of this, ATR works best as a support tool alongside a separate trend or momentum filter, never as a stand-alone buy/sell signal.
How to use ATR with a direction filter
Since ATR only measures volatility, you need something to tell you direction. A common approach is to pair the ATR Trailing Stop with a trend filter such as a moving average, or a momentum reading from an oscillator like the DeMarker. The idea is simple: take long-side setups only when your trend filter points up and price sits above the trailing stop, and short-side setups only when the filter points down and price sits below the line. The colour flip on the trailing stop then acts as confirmation rather than the sole trigger.
If you are combining tools, keep it to two or three that measure different things. Stacking several volatility indicators on top of each other tells you the same story twice. For more on layering indicator settings on this platform, see our notes on IQ Option indicator settings.
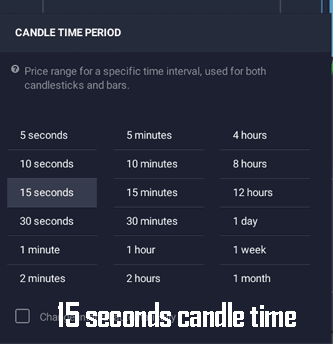
Timeframe and entry rules
Lower timeframes such as 5-second or 15-second candles react quickly but produce far more noise and false flips. Higher timeframes smooth that noise out but give fewer, slower signals. In our own testing, very fast frames produced a lot of whipsaw, while a 15-minute chart gave cleaner, more readable structure. There is no perfect frame — it is a trade-off between speed and reliability, and the right choice depends on your style and the asset you trade.
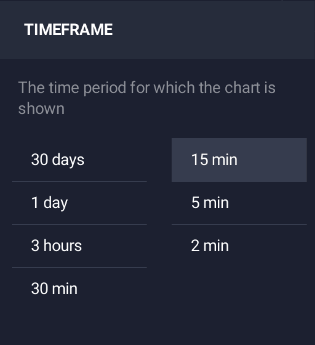
A workable checklist looks like this: confirm the trend direction with your filter, wait for price to close on the correct side of the ATR trailing stop, then enter and let the trailing line define your exit. If price and the stop keep flipping back and forth, the market is ranging — that is usually a signal to stand aside rather than force trades.
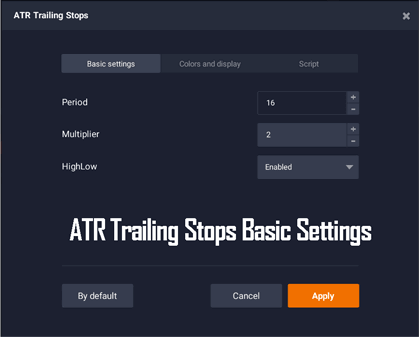
Advance ATR Trailing Stop - Settings
The settings below are a reasonable starting point for a short-term IQ Option setup. Treat them as a baseline to test on a demo account, not a fixed rule — every asset and timeframe behaves differently, so you will likely need to adjust.
- Period - 16
- Multiplier - 2
- HighLow - Enabled
A shorter period reacts faster but flips more often; a larger multiplier holds the stop further from price, giving trades more room but wider risk. The free ATR only reads short-term range, while the advanced script adds smoother trailing behaviour.
The Advance ATR Trailing Stops script for IQ Option is included with a $39 lifetime membership, alongside the rest of our indicator library. If you also trade short expiries, our IQ Option 1-minute strategy pairs naturally with this volatility approach.
Risk management
No indicator removes risk, and ATR is no exception. Because it is a volatility gauge, it can widen sharply during news events and leave your stop far from entry. Keep each trade to a small, fixed portion of your account, decide your maximum loss before you enter, and accept that losing trades are a normal part of any method. Avoid martingale-style position sizing, where you double up after a loss — it can wipe out an account very quickly during a losing run. Practise on a demo account until the rules feel automatic before risking real capital.
Advance ATR Trailing Stops - Video
Frequently Asked Questions
Does the ATR strategy win every trade?
No. No indicator or strategy wins every trade, and ATR does not predict market direction — it only measures volatility. Expect losing trades and manage risk on every position rather than chasing a perfect record.
What does ATR actually tell me?
It tells you how much an asset is moving on average over your chosen period. A high ATR means large price swings; a low ATR means a quieter market. It says nothing about whether price will rise or fall, which is why a separate direction filter is important.
Which timeframe should I use?
There is no single best answer. Faster frames give more signals but more noise; slower frames are cleaner but slower to react. Test a few on a demo account and pick the one that matches your trading style and the asset you follow.
This content is for educational purposes only and is not financial advice. Trading involves substantial risk; you can lose some or all of your capital. No result is guaranteed and past performance does not indicate future results. Trade only what you can afford to lose.