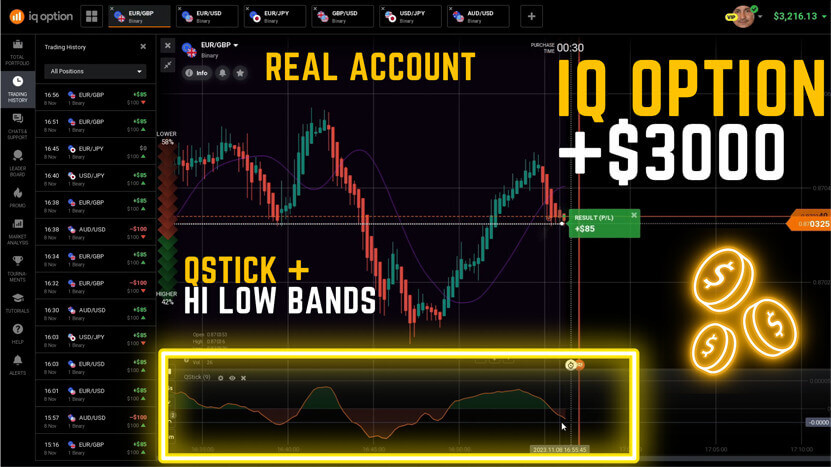
IQ Option Live Trading - Real Account
This walkthrough pairs the QStick indicator with the Hi-Low Bands indicator on the IQ Option platform, using the Dream-X indicator as a trend filter. The idea is to spot when momentum is fading and price is stretched away from its recent range, which can hint at a pullback or reversal. None of these tools predict the future - they simply describe what price has already done, so treat every setup as a probability, not a certainty.
What QStick and Hi-Low Bands Actually Measure
Understanding what each indicator does - and where it fails - matters far more than the exact settings.
- QStick indicator: QStick is a moving average of the difference between each candle's open and close, so it measures the momentum of candle bodies. Readings above the zero (middle) line suggest recent candles are closing higher than they open; readings below suggest the opposite. Because it is body-based, QStick can whipsaw badly in choppy, low-range conditions and lag at sharp turns. Suggested setting: QStick period 9.
- Hi-Low Bands indicator: The Hi-Low Bands plot a channel around recent highs and lows, with a central line that shifts as the range moves. Price tagging the outer band can flag that a move is stretched. But bands react to volatility - in a strong trend price can ride one band for a long time, so a band touch alone is not a reversal signal. Suggested settings: period 10, percent shift 0.1, source Close.
Settings, Timeframe and Entry Rules
This is a short-timeframe approach, so slippage and platform payout matter. Start by scanning for pairs that are ranging rather than trending hard - the Dream-X filter helps here, since a neutral (uncoloured) reading points to calmer conditions where mean-reversion setups behave more predictably. Avoid pairs where Dream-X is strongly coloured in one direction.
- Assess the trend: Confirm the Dream-X indicator is near its neutral level (no strong colour). This is your context filter - skip the setup if a hard trend is in play.
- Read the indicators together: Look for price reaching the outer Hi-Low Band while QStick is crossing back through its middle line. Alignment between the two adds confidence; a signal from only one is weaker and easy to false-trigger on.
- Wait for confirmation: Let the candle close before acting rather than entering mid-candle. Confirmation reduces the number of fakeouts you take, at the cost of a slightly later entry.
Compare this logic with the IQ Option 1 minute strategy or review the parameter choices in our guide to IQ Option indicator settings before committing to any single configuration.
Realistic Expectations
Both indicators are lagging by design, so they will hand you losing signals during choppy news-driven sessions and when a range suddenly breaks into a trend. Test the settings on a demo account first, keep a written log of the setups you took, and only move to live money once you understand how the combination behaves in different conditions. Slower, confirmed entries usually beat chasing every band touch.
Risk Management
Short-timeframe trading amplifies mistakes, so risk control is the part that actually protects your account. Risk only a small, fixed fraction of your balance per trade and accept that strings of losses are normal. Do not use martingale or any doubling-after-a-loss scheme - increasing size to chase back losses can wipe out an account quickly and is one of the fastest ways to blow up. Set a daily loss limit, walk away when you hit it, and never trade money you cannot afford to lose. The full indicator pack, including these tools, is available with lifetime access for $39.
Frequently Asked Questions
Does this strategy win every trade?
No. No strategy or indicator combination wins every trade. QStick and the Hi-Low Bands both lag price and produce false signals, especially in choppy or fast-trending markets. Expect losing trades and manage risk accordingly.
What timeframe works best for QStick and Hi-Low Bands?
It is often used on very short IQ Option timeframes, but shorter charts carry more noise and false signals. Many traders find the setup calmer and easier to confirm on 1-minute or higher charts. Test different timeframes on a demo account to see what suits your style.
Do I need the Dream-X indicator as well?
Dream-X is used here only as a trend filter to help you avoid taking reversal setups against a strong trend. It is optional - you can trade the QStick and Hi-Low Bands logic on its own, but a trend filter of some kind tends to cut down on low-quality signals.
This content is for educational purposes only and is not financial advice. Trading involves substantial risk; you can lose some or all of your capital. No result is guaranteed and past performance does not indicate future results. Trade only what you can afford to lose.