Olymp Trade 1-Minute Reversals With Two Parabolic SAR
This is a short-expiry reversal method for Olymp Trade built around two Parabolic SAR configurations read on the 1-minute chart. Parabolic SAR stands for "Stop and Reverse," and the dots it plots mark points where a move may be running out of steam and could flip direction. Read this first: a SAR flip is decision support, not a promise. You still confirm the context and manage the risk on every trade.
What Parabolic SAR Actually Does — And Where It Fails
Parabolic SAR is a trend-following tool. When price is trending, the dots trail below an uptrend or above a downtrend and stay on one side until momentum genuinely turns. The honest weakness matters just as much: in a ranging or sideways market SAR whipsaws badly. With no real trend, the dots jump from one side of price to the other candle after candle, firing "reversal" after "reversal" that goes nowhere. On a 1-minute chart, which spends much of its time flat, this happens often. SAR only earns its keep when there is a trend to reverse — when the market drifts flat, the cleanest decision is usually no trade.
Why Two Parabolic SAR Configurations
Using two SARs separates trend context from timing. You run one slower SAR that reflects the broader 1-minute direction and one faster SAR that flips earlier at a turn. A reversal is only worth considering when both agree: the faster line flipping while the slower one still points the old way is exactly the kind of premature signal that fails in chop. When the two line up on the same side of price at the top or bottom of a move, you have a cleaner read than a single SAR gives.
Recommended Settings
The inputs are the standard Parabolic SAR fields in MetaTrader or on the Olymp Trade chart:
- SAR 1 (context): Step 0.02, Maximum 0.20 — the classic setting, slower to flip, used to gauge the prevailing 1-minute direction.
- SAR 2 (timing): Step 0.04, Maximum 0.20 — a faster, more sensitive version that flips earlier and marks the potential turn.
- Timeframe: 1-minute chart with a 1-minute expiry to match the candle you are reading.
Raising the step makes SAR more sensitive and quicker to reverse; lowering it makes SAR slower and steadier. Keep the charts uncluttered so both dot trails read easily under a short expiry, and trade a small number of liquid pairs you actually know.
Entry Logic and Confirmation
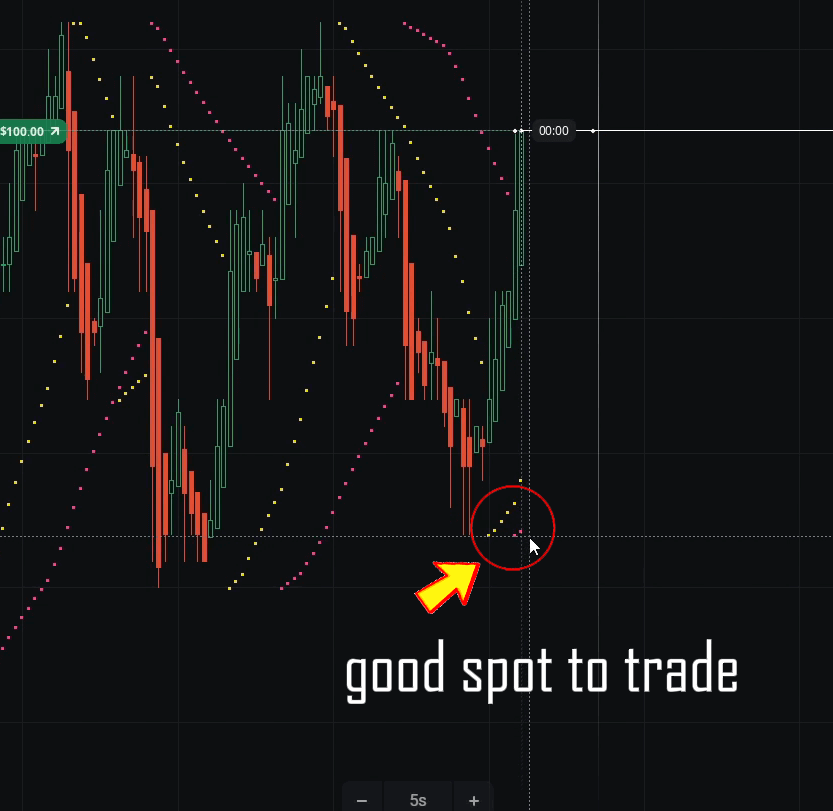
- Higher (buy / call): after a down move, both SAR dots flip from above price to below it, the faster turning first and the slower confirming. A candle closing back up off the low adds weight to a possible reversal higher.
- Lower (sell / put): after an up move, both SAR dots flip from below price to above it, the faster leading and the slower confirming, as price fails under recent resistance.
- Stand aside: the two SARs disagree, or price is stuck flat and the dots are flip-flopping. A disagreement between the fast and slow SAR is a warning that there is no trend to reverse — wait for the chart to resolve rather than forcing a trade.
For confirmation, a support/resistance level, a swing high or low, or a simple momentum reading all help. The most useful filter is plain: if you cannot point to a clear prior trend the signal is reversing, skip it.
Timeframe, Expiry and Risk
This is a 1-minute reading with a 1-minute expiry; in choppier conditions a 2-minute reading cuts down on false flips. Whatever expiry you choose, risk control keeps you in the game: stake a small, fixed fraction of your balance per trade, cap how many trades you take in a session, and stop for the day once you hit a preset loss limit. Never chase a losing streak by doubling your stake to "win it back" — that martingale approach can wipe an account in a single bad run. No indicator removes losing trades, so aim for steady, repeatable decisions and practise on a demo account until the reads feel automatic before risking real funds.
FAQ
Does two Parabolic SAR guarantee a reversal will happen?
No. A double-SAR flip only marks a point where a reversal is more plausible than a moment ago. SAR is a trend tool and it whipsaws in sideways markets, so plenty of flips fail. It is a filter to help you focus, not a signal to trade blindly.
Which platforms can I use this on?
The method reads the same on any 1-minute chart that offers Parabolic SAR — Olymp Trade here, but also MetaTrader (MT4 / MT5) and other trading platforms such as Quotex or Pocket Option. Full, ready-to-load settings and the rest of the indicator library come with the single $39 lifetime plan.
What is the best timeframe and expiry?
The 1-minute chart with a 1-minute expiry is the core setup. In choppier conditions a 2-minute reading helps filter weak flips. Match the expiry to the timeframe you read the signal on.
For more short-expiry Olymp Trade methods, compare this with the Olymp Trade 1 minute strategy, the faster Olymp Trade Quickler 5 second strategy, and the Quickler Option guide.
This content is for educational purposes only. Trading involves risk. Past results do not guarantee future outcomes. Always practice responsible money management and limit your daily trades to avoid large losses.