Best Olymp Trade Strategy 2024
Search for the "best" Olymp Trade strategy and you will find plenty of confident claims. The honest answer is that there is no single best setup for everyone. The right approach depends on the asset you trade, the timeframe you watch, and how disciplined you are with risk. What we can offer is a clear, rules-based method: combining Bollinger Bands with the Commodity Channel Index (CCI). Both indicators are available on most trading platforms, and together they give you a structured way to read volatility and momentum instead of guessing.
Understanding the Use of Bollinger Bands
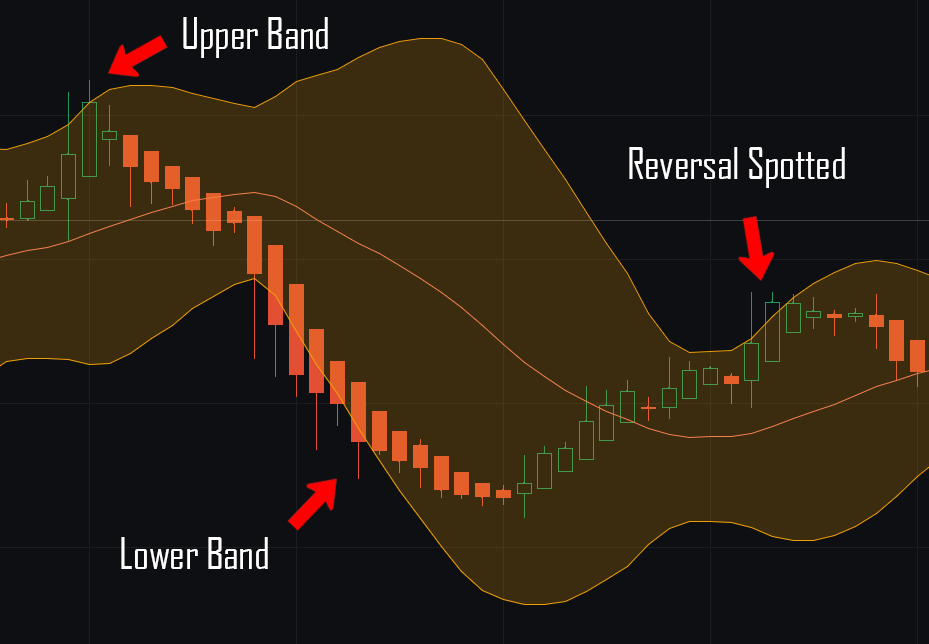
Bollinger Bands is a volatility indicator made up of three lines: a middle moving average and two outer bands set a number of standard deviations away from it. The bands expand and contract as market volatility changes, which makes them a quick visual read on how much a price is moving.
How Bollinger Bands are commonly used:
- Reading volatility: When the upper and lower bands separate widely, the market is more volatile; narrow bands suggest calmer, lower-volatility conditions.
- Overbought or oversold context: A candle that pushes into the upper band may signal an overextended move higher, while a touch of the lower band may point to an overextended move lower. These are context clues, not automatic buy or sell orders.
- Watching for reversals: In ranging markets, price that reaches one band often drifts back toward the middle band. This behaviour is where a reversion idea comes from.
How to Use the Commodity Channel Index (CCI)
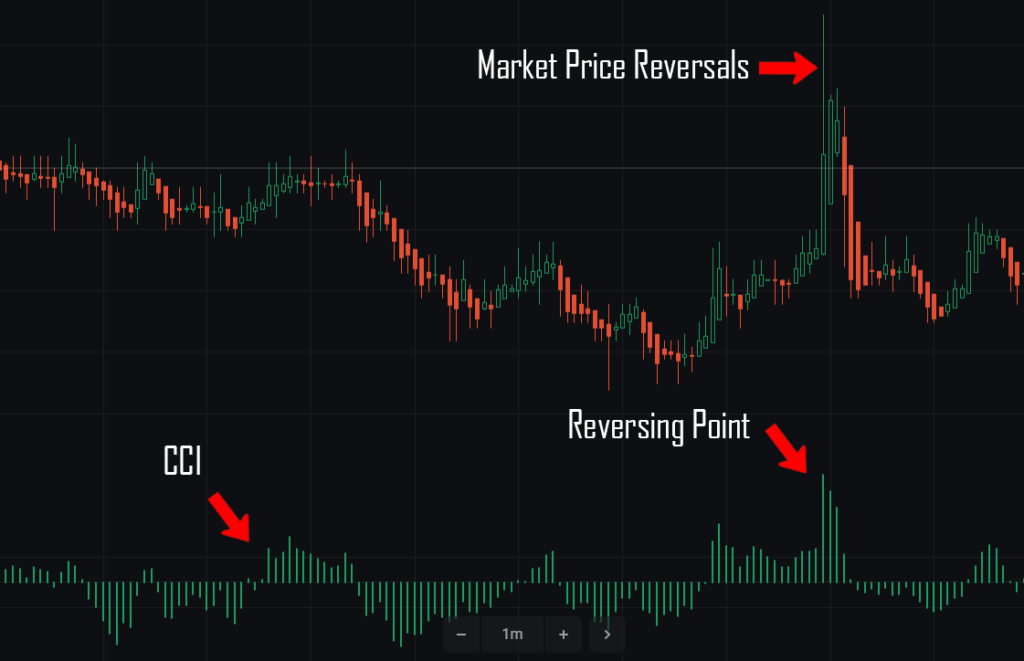
The CCI is a versatile momentum indicator that measures the current price level relative to an average price level over a chosen period. Traders often use it to gauge whether a move is gaining strength or losing it.
How CCI is commonly applied:
- Gauging trend strength: A rising or falling CCI reading can hint at whether an uptrend or downtrend is building or fading.
- Spotting divergence: If price makes a new high but the CCI does not, that mismatch can warn of a weakening move and a possible reversal.
- Overbought and oversold zones: Like Bollinger Bands, extreme CCI readings flag stretched conditions that may be due for a pause or pullback.
Timeframe and Entry Rules
Using two indicators together helps filter out weaker signals, because you wait for both to agree before you act. No timeframe suits everyone, so test the method on a demo account first and pick one you can actually watch.
- Set up your chart: Apply Bollinger Bands and CCI on your chosen timeframe. Adjust the parameters to suit the asset rather than assuming defaults are ideal.
- Wait for confluence: Look for price reaching an outer Bollinger Band while the CCI shows a matching overbought or oversold reading.
- Confirm with divergence: Check whether the CCI diverges from price, which can strengthen the case for a reversal.
- Define the entry: A common entry is when price turns back from an outer band toward the middle band while the CCI eases back from its extreme. Decide your exit before you enter.
Why "Best" Depends on Context
A strategy that works well on a trending pair during volatile hours can behave very differently on a quiet, ranging market. That is why "best" is always relative. The strongest edge usually comes from consistency, patient entries, and risk control rather than any one indicator combination. Treat this method as a framework to test and adapt, not a fixed formula. If you want related short-timeframe ideas, see our Olymp Trade 1 minute strategy and the Quickler option walkthrough.
Risk Management
No indicator setup removes the risk of losing trades. Protect your capital by risking only a small portion of your account on any single position, keeping a sensible stop or exit plan, and avoiding trades taken purely on emotion after a loss. Be especially wary of martingale-style systems that tell you to double your stake after each loss; a short losing streak can drain an account very quickly, and this is a warning, not a recommendation. Journaling your trades tends to help more than chasing the next "perfect" indicator.
Everything discussed here is available with the indicators bundled in our full toolkit. You can unlock all of them with a single $39 lifetime purchase, but the strategy itself can also be built with the tools already on your platform.
Frequently Asked Questions
Does this strategy win every trade?
No. No strategy wins every trade, and any source that promises otherwise is not being honest. The Bollinger Bands and CCI combination is a tool for making more structured decisions, but losses are a normal part of trading and should be expected.
Which timeframe should I use?
There is no universal answer. Shorter timeframes give more signals with more noise, longer ones give fewer but steadier signals. Test several on a demo account and pick the one that fits your schedule.
Do I need to buy indicators to try this?
Not necessarily. Bollinger Bands and the CCI are standard on most trading platforms, so you can build and test this method with the built-in tools first.
This content is for educational purposes only and is not financial advice. Trading involves substantial risk; you can lose some or all of your capital. No result is guaranteed and past performance does not indicate future results. Trade only what you can afford to lose.