Olymp Trade Moving Averages Strategy: A Practical Guide
Moving averages are among the most widely used tools on any trading platform, and this guide walks through a multi-line moving average setup for short-term trading on Olymp Trade. The idea is simple: use several averages together to read trend direction and strength before committing to a position. It is a discretionary approach, not an automated system, and like every technical method it works better in some conditions than others.
What Moving Averages Actually Do
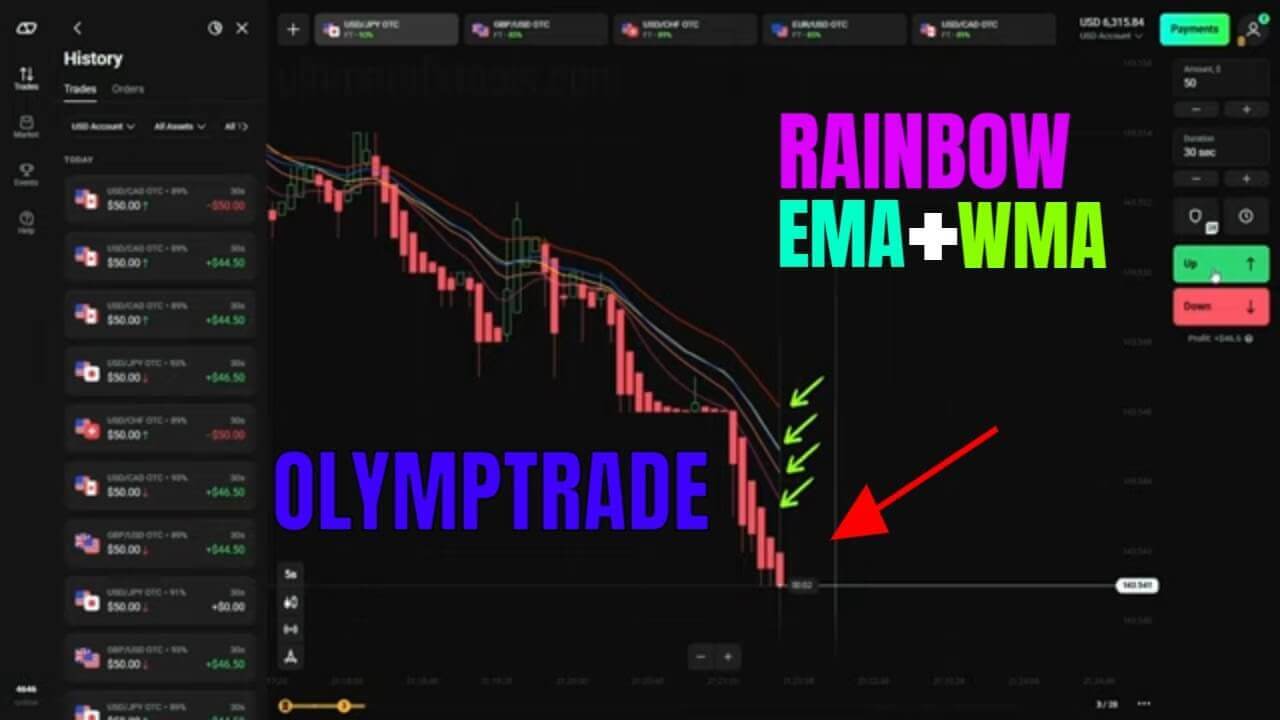
A moving average smooths price into a single flowing line by averaging recent closes. A Weighted Moving Average (WMA) and an Exponential Moving Average (EMA) both give more weight to recent prices, so they react faster than a simple average. Stacking multiple averages lets you judge trend health at a glance: when the lines fan out in order and hold their spacing, momentum is present; when they knot together and cross repeatedly, the market is likely ranging. Remember that averages are lagging indicators — they describe what price has already done, not what it will do next.
The Setup
This configuration uses five averages of different lengths so you can see how short and longer lookbacks relate to one another:
- WMA periods: 14, 21, and 27
- EMA periods: 20 and 31
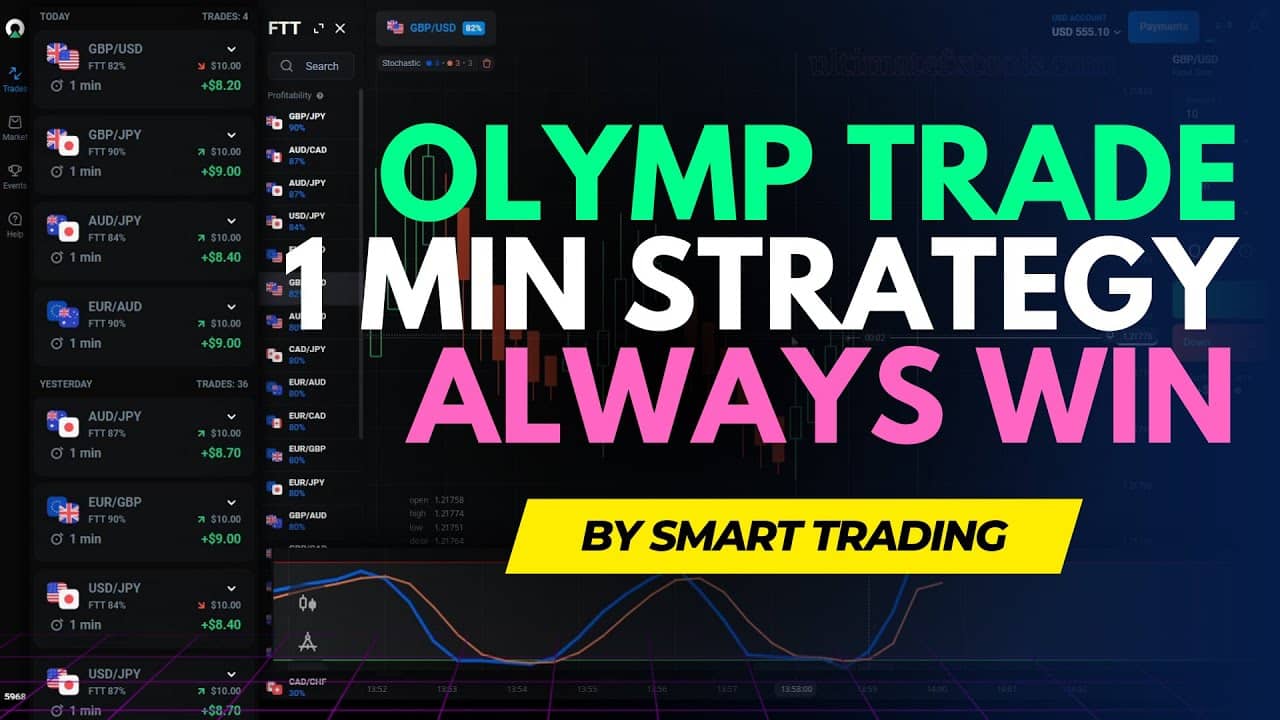
You can apply it to fast Heiken Ashi candles for very short-term reads, but the same alignment logic is more reliable on higher timeframes such as the 1-minute or 5-minute chart, where individual candles carry less noise. If you prefer a slower pace, the Olymp Trade 1 minute strategy covers a comparable trend-following idea with more room to confirm signals.
Reading Entries
- Confirm alignment. Wait until all five lines slope in the same direction and hold clear, even spacing. Overlapping or tangled lines are a signal to stand aside, not to trade.
- Wait for the candle to agree. Let price and the current candle move in the direction the averages suggest before entering, rather than anticipating a move that has not started.
- Match expiry to the chart. Keep your trade duration in proportion to the timeframe you are reading. Very short expiries leave almost no margin for the lag built into the averages.
The Whipsaw Weakness
The honest limitation of any moving average method is the whipsaw. In a sideways or choppy market the lines cross back and forth, throwing off false signals that look like the start of a trend and then reverse. The shorter your timeframe, the more often this happens, because random noise dominates genuine direction. No period combination removes this — it is inherent to how averages work. Treat the setup as a filter that keeps you out of unclear conditions, not as a mechanism that turns every crossover into a reliable trade.
Risk Management
Position sizing matters far more than any indicator setting. Risk only a small, fixed amount per trade so a normal run of losing trades cannot damage your account, and accept losses at your planned exit instead of chasing them. Avoid martingale-style recovery — doubling or tripling stake size after a loss to "win it back" is one of the fastest ways to lose an entire balance, because a short losing streak escalates your exposure beyond what you can afford. Practise the setup on a demo account first, and keep a simple log of your trades so you can see how it behaves for you in real conditions.
Realistic Expectations
Used with discipline, a multi-average setup can help you stay on the right side of a trend and skip messy, directionless periods. It will not predict price and it will produce losing trades — every trader has them. Combining it with a second form of confirmation, such as a momentum reading or a look at a higher timeframe, tends to filter out weaker signals. For a faster, related approach, see the Olymp Trade Quickler 5 Second Strategy.
If you want ready-made moving average and trend indicators for MT4 and MT5, our full toolkit is available for a one-time $39 lifetime payment.
FAQ
Does this strategy win every trade?
No. No strategy wins every trade. Moving averages lag price and give false signals in ranging markets, so losses are a normal part of using this method. Sound risk management is what keeps those losses manageable.
Which timeframe is best for it?
There is no single best timeframe. Very short candles are noisier and produce more whipsaws, while the 1-minute or 5-minute chart gives clearer alignment. Test a few and use whichever fits your style and available screen time.
Can I automate this setup?
The reading of alignment and spacing is discretionary, so it is best applied manually. You can, however, load the five averages as indicators so the lines are drawn for you and you only make the judgement call on entries.
This content is for educational purposes only and is not financial advice. Trading involves substantial risk; you can lose some or all of your capital. No result is guaranteed and past performance does not indicate future results. Trade only what you can afford to lose.