2 Pocket Option Indicators | Williams %R and CCI
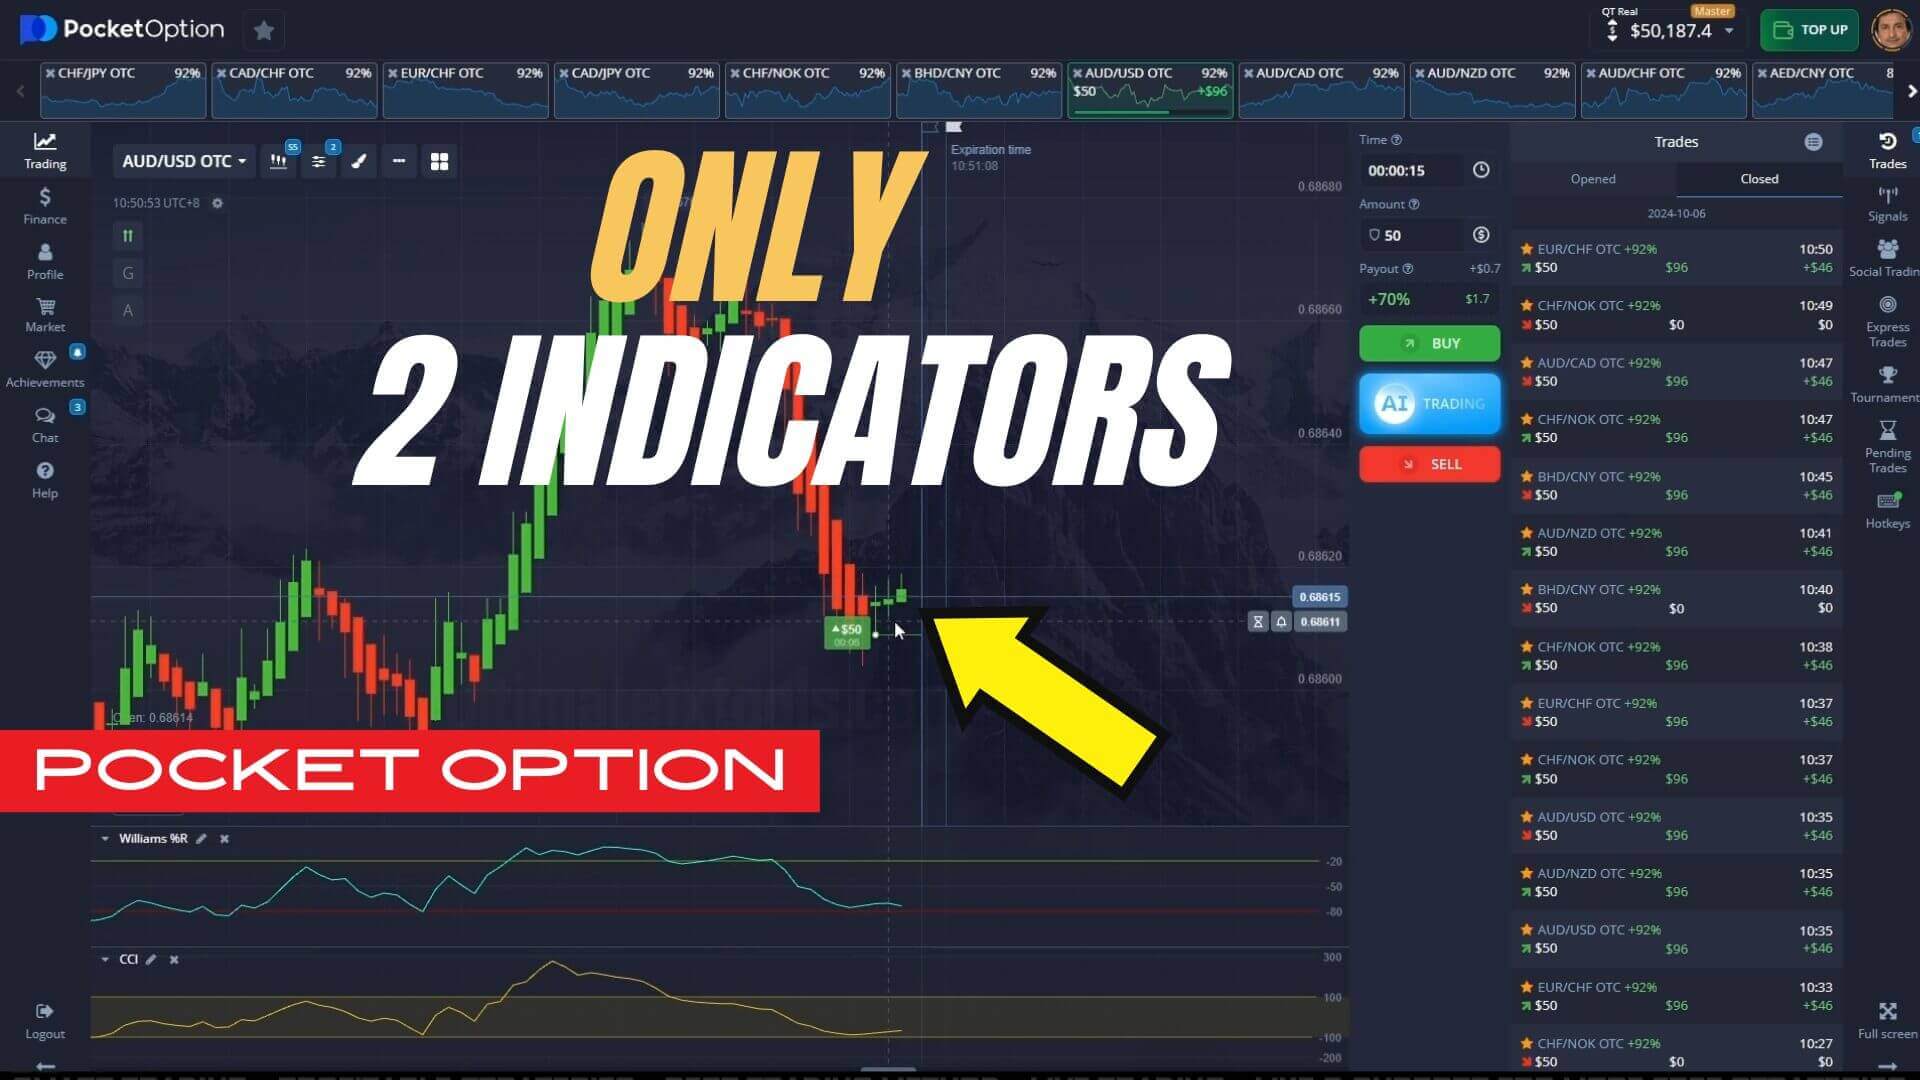
The appeal of a two-indicator setup is simplicity: fewer readings on the chart, fewer conflicting signals, and a routine that is easier to follow under pressure. This Pocket Option approach pairs the Williams Percentage Range (%R) with the Commodity Channel Index (CCI). Below is what each measures, an honest note on why two oscillators are not independent confirmation, and how to structure entries and risk. Simple does not mean easy, and no setup makes any trade a sure thing.
What Each Indicator Measures
Williams %R is a momentum oscillator that shows where the current close sits relative to the high-low range of a recent lookback period, on a scale from 0 to -100. Readings near the top flag a market that has pushed high within its range; readings near the bottom flag the opposite.
CCI compares the current price to its average over a chosen period, oscillating around a zero line and often read against the +100 and -100 bands. It is designed to highlight when price has stretched unusually far from its mean.
Why Two Oscillators Are Not Independent Confirmation
This is the most important caveat. Williams %R and CCI are both momentum oscillators built from recent price and range. When one reaches an extreme, the other frequently does too, because they are reacting to the same move in the same data. That is correlation, not two independent votes. Treat their agreement as a single momentum read expressed two ways, and expect both to give false signals together during strong trends or choppy conditions. If you want genuinely different information, pair a momentum tool with something that measures a different dimension, such as a volatility or trend filter.
Pocket Option Charting Setup
- Chart type: a Heiken Ashi chart smooths price action and can make the direction of a short-term swing easier to read than standard candles.
- Candle time frame: very short frames such as 5 seconds are fast-moving and noisy. The faster the frame, the more false extremes both oscillators will print, so shorter is not automatically better.

 Unlock Indicator Settings
How to Read Entries
The idea is to wait for both oscillators to sit at an extreme and then let price confirm before acting, rather than fading an extreme on its own:
- Possible reversal higher: both %R and CCI near the bottom of their ranges, followed by a green candle forming. Some traders read this as a bounce setup.
- Possible reversal lower: both oscillators near the top, followed by a red candle. This can suggest momentum is fading.
- Stand aside: if the two disagree, or price is trending hard against the signal, there is no edge in forcing a trade. In a strong trend an oscillator can stay pinned at an extreme far longer than expected.
Because both indicators can be wrong at the same time, waiting for a candle to confirm and skipping unclear conditions matters more than the settings themselves. For a different way to combine momentum with trend, compare the Schaff Trend Cycle and Momentum setup.
Realistic Expectations and Risk Management
Short-expiry trading is high variance, and this setup will produce losing trades in any normal stretch. Manage that reality instead of ignoring it:
- Practice on a demo account until the routine is second nature before risking real money.
- Risk only a small, fixed amount per trade so a run of losses cannot wipe out the account.
- Avoid martingale. Doubling stake size after a loss to "win it back" scales risk faster than most balances can survive and can lead to a total loss on a single losing streak.
- Keep a simple log so you can judge the approach over many trades, not one or two.
If you want the exact indicator parameters used in the screenshots above, the full pack is available with lifetime access for $39.
FAQ
Does this two-indicator setup win every trade?
No. No indicator combination wins every trade. Williams %R and CCI can both give false signals at the same time, and short time frames add noise. Expect losing trades and size your risk so they are survivable.
Are Williams %R and CCI redundant?
Largely, yes. They are both momentum oscillators derived from recent price, so they tend to move together and often reach extremes at the same time. Their agreement is one signal seen twice, not two independent confirmations.
What time frame should I use on Pocket Option?
That depends on how much noise you can tolerate. Very short frames like 5 seconds move fast and produce more false extremes; slightly longer frames give steadier readings. Test different settings on a demo before committing real money.
This content is for educational purposes only and is not financial advice. Trading involves substantial risk; you can lose some or all of your capital. No result is guaranteed and past performance does not indicate future results. Trade only what you can afford to lose.