"Pocket Option OsMA"
"Exponential Moving Average"
"Perfect Pocket Option Strategy"
Pocket Option OsMA with 2 EMA
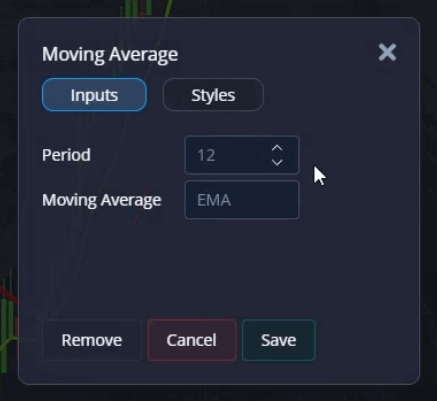
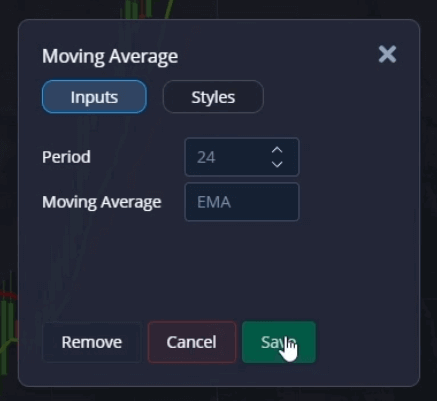
We’ve developed a straightforward trading strategy that harnesses the power of two specific indicators - the Exponential Moving Averages (EMA) with periods of 12 and 24. These indicators are instrumental in our approach and provide a simplified way to anticipate potential market reversals, particularly when trading on shorter timeframes.
The Exponential Moving Averages are versatile tools that lend themselves well to various trading strategies. Their smooth plotting of price data over a specified period makes it easier to identify the overall trend, whether bullish or bearish. The EMA with a period of 12 is faster and more sensitive to price changes, closely reflecting current market movements. On the other hand, the EMA with a period of 24 is slower and offers a more comprehensive view of the market dynamics over a longer period.
This dual-EMA setup is integral to our strategy as it offers valuable insights into potential price reversals. By observing the interplay between these two EMAs, we can pinpoint moments when the faster EMA (12-period) crosses above or below the slower EMA (24-period). These crossover points often signal a change in trend direction, providing a strategic entry or exit point for trades.
Moreover, our trading strategy is especially effective for shorter-duration trades. This is because, in shorter timeframes, market trends and reversals occur more frequently, allowing for numerous trading opportunities. Utilizing the 12 and 24-period EMAs allows us to navigate these swift changes efficiently and capitalize on potential market shifts.
In summary, our current trading methodology, centered around using the 12- and 24-period Exponential Moving Averages, provides an easy-to-follow strategy for identifying and acting on potential reversals, especially in shorter-duration trades.
Easy Trading with these Free Strategy with OsMA
This strategy is particularly suited for those interested in gauging potential market trends and their behaviors.
The strategy revolves around using two key trading indicators: a set of two Exponential Moving Averages (EMAs) and the OsMA indicator.
The EMA is a type of weighted moving average that gives more importance to the most recent price data. In this strategy, we will use two sets of EMAs: one with a fast period of 8 and another with a slower period of 21. Using two EMAs with different periods is to identify potential crossovers, which may indicate a potential market trend shift.
On the other hand, the OsMA (Oscillator of Moving Average) is a tool that helps traders identify periods where the market may be overbought or oversold. It subtracts the signal line from the MACD line to give an oscillator that swings above and below zero. For this strategy, we will use an OsMA with a Signal SMA (Simple Moving Average) period of 11.
The combination of these two indicators serves the purpose of navigating our potential trending market and provides us with information about market behavior. The EMA crossover indicates the direction of the trend, while the OsMA helps us determine the momentum of the market trend.
In terms of time frame, the strategy is designed to work on a 15 seconds duration with a 5 seconds candle time. This makes it a short-term trading strategy, suitable for traders who prefer quick trades and can monitor the markets closely.
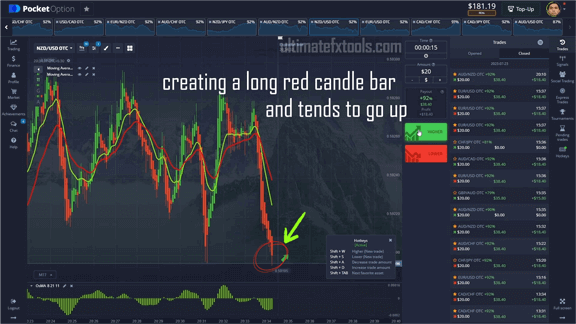
The application of this strategy involves monitoring for EMA crossovers and the OsMA indicator. When the fast EMA (8 period) crosses above the slow EMA (21 period), it may indicate a bullish trend. Conversely, when the fast EMA crosses below the slow EMA, it may indicate a bearish trend.
At the same time, watch the OsMA indicator. If it crosses above the zero line, it may indicate a bullish momentum. If it crosses below, it may indicate bearish momentum.
Remember, as with all trading strategies, this strategy does not guarantee profits and involves risk. Practice this strategy on a demo account before using it in live trading. Always use appropriate risk management techniques to protect your trading capital.