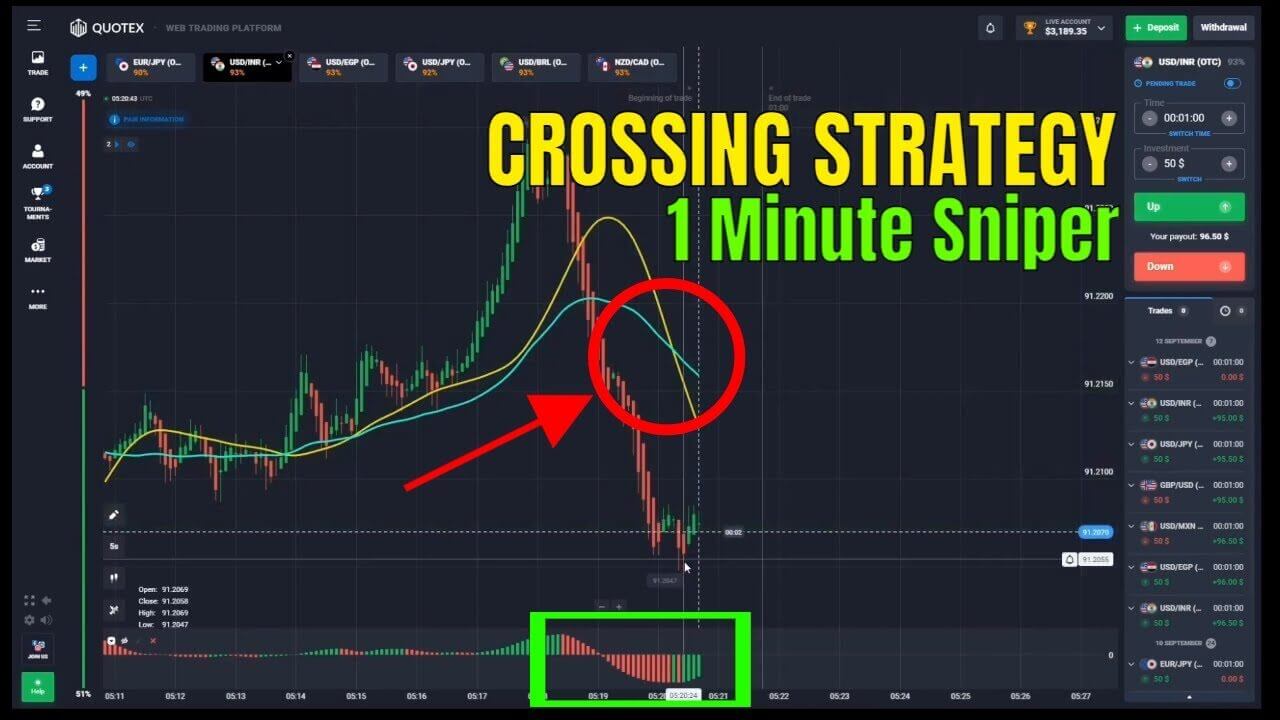
Quotex Crossing Strategy Explained
The Quotex Crossing Strategy is a moving-average crossover method built around two lines: the Triangular Moving Average (TMA) and the Weighted Moving Average (WMA). The idea is simple: when the faster line crosses the slower one, the short-term direction of price may be shifting, and traders use that cross as a cue to look for a trade. Like every crossover method, though, it has real limitations you should understand before relying on it.
What the crossover setup is
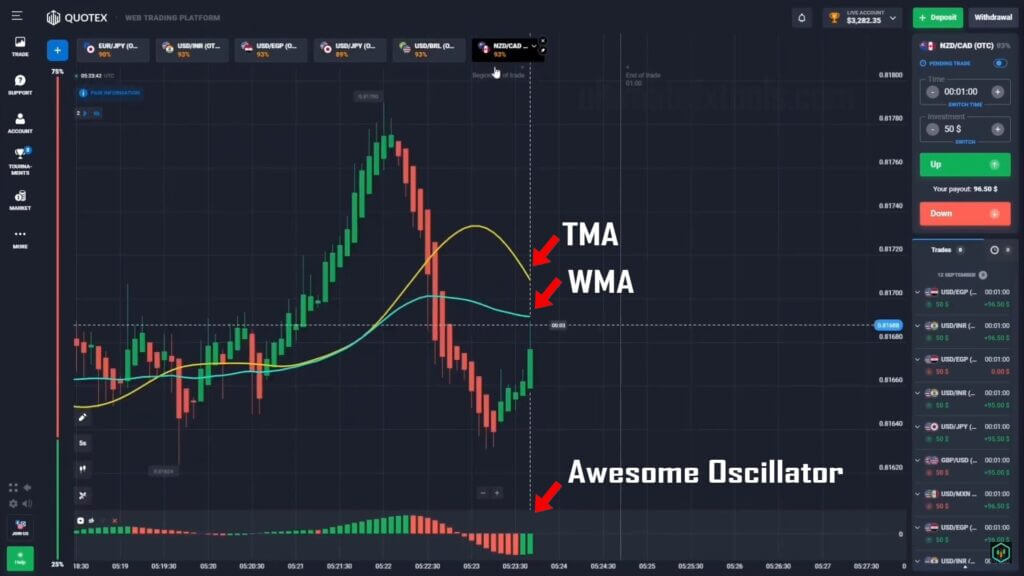
Two averages sit on the chart. The TMA (shown as a yellow line) is heavily smoothed, so it reacts slowly and filters out a lot of noise. The WMA (a blue-green line) weights recent prices more heavily, so it turns faster. When the WMA crosses above the TMA, the short-term average is pulling ahead of the smoothed one, which points to building upward momentum. A cross in the opposite direction points to weakening momentum. Because the two lines measure the same price at different speeds, a crossover is simply a structured way of noticing that the pace of the move has changed.
Many traders add the Awesome Oscillator as a second opinion. When its histogram shifts from red to green after a low, that momentum reading agrees with an upward crossover. Requiring two tools to agree filters out some weak signals, though it will never remove them all.
Settings, timeframe and entry rules
A practical starting point is a short intraday timeframe, such as the 1-minute chart, with the TMA and WMA both set to a moderate period so the lines separate clearly. Keep the settings as a baseline and adjust to the asset you trade rather than treating any number as fixed. A reasonable entry checklist looks like this:
- Wait for a clean cross: the WMA should close through the TMA, not just touch it.
- Check the Awesome Oscillator: look for the histogram colour to agree with the direction of the cross.
- Read the wider trend: take crosses that point in the same direction as the higher-timeframe trend and skip those that fight it.
- Skip flat conditions: if the two lines are tangled and flat, there is no momentum to trade.
The whipsaw weakness
This is the part most tutorials skip. Crossover strategies lag by design, because an average can only describe prices that have already printed. In a strong trend that lag is tolerable, but in a ranging or choppy market the two lines cross back and forth repeatedly, producing a stream of false signals known as whipsaws. Each of those crosses can trigger a losing trade even when you follow the rules exactly, and on very fast timeframes the problem is worse. No amount of confirmation fully removes this; the honest expectation is that a meaningful share of signals will fail, clustered in sideways markets. Recognising a choppy chart and standing aside is often more valuable than any entry signal.
Realistic expectations
Treat the crossing strategy as a way to structure your reading of momentum, not as a prediction engine. It works best when the market is genuinely trending and struggles the rest of the time. Test it on a demo account first and accept that losing streaks are a normal part of any method. If you want to compare approaches, the Quotex Easy Strategy and the Quotex 1 Minute Strategy 2022 cover related setups worth studying alongside this one.
Risk Management
No entry method matters more than how you size and control risk. Trade only what you can comfortably afford to lose, and keep each position small relative to your total balance so a run of whipsaw losses cannot wipe you out. Set a daily loss limit and stop when you hit it. Avoid overtrading, since forcing signals in a flat market is one of the fastest ways to give back capital. A firm warning on martingale-style recovery — doubling your stake after a loss to chase it back — is that it can escalate a normal losing streak into a catastrophic loss very quickly, and it is not a substitute for a sound method.
If you want the exact indicator files and a ready-made template rather than rebuilding everything by hand, the full library is available with lifetime access for $39.
Frequently Asked Questions
Does the Quotex Crossing Strategy win every trade?
No. No strategy wins every trade, and crossover methods in particular produce false signals during ranging markets. Expect losing trades, manage your risk on every position, and judge the method over a large sample rather than by any single result.
What timeframe works best for the crossover?
Short intraday charts such as the 1-minute are popular, but faster charts also carry more noise and more whipsaws. Test a couple of timeframes on a demo account and choose the one where the signals are cleanest for the asset you trade.
Do I need the Awesome Oscillator as well?
It is optional. The Awesome Oscillator acts as a second confirmation and can filter out some weak crosses, but adding indicators also adds lag, so some traders prefer the two moving averages alone.
This content is for educational purposes only and is not financial advice. Trading involves substantial risk; you can lose some or all of your capital. No result is guaranteed and past performance does not indicate future results. Trade only what you can afford to lose.


