IQ Option Breakout - 1 Minute Script
An IQ Option breakout script for 1-minute trades - what it flags, why false breakouts are common, how to confirm one, and how to manage risk.

What the Script Flags
The script measures where price is trading relative to a recent range. When a candle closes — or in aggressive settings simply trades — beyond the upper or lower boundary of that range, it marks a potential breakout. On a one-minute chart this happens often, because short timeframes are noisy and small bursts of activity regularly nudge price past a level. Many of those pushes are not the start of a trend; they reverse within a candle or two. The script tells you where attention is warranted, not whether the move is real.
Why False Breakouts Happen — and How to Confirm
Markets spend a large share of the time ranging rather than trending. Inside a range price repeatedly tests the edges and bounces back, so a level that looks "broken" for a moment is often just being tested — and this is where breakout signals fail most. Confirmation separates a level being tested from one being broken:
- Wait for the close. A candle that closes clearly beyond the level means more than a wick that pierces it and pulls back. Judge the signal only after the candle fully forms.
- Look for momentum. A genuine breakout usually arrives with a wider candle body and a burst of activity, not a thin, hesitant push through the level.
- Check the backdrop. Breakouts are more trustworthy when the wider market is already trending that way. In a flat, directionless market, treat almost every flag with suspicion.
- Use a second tool. A momentum or trend filter gives a second opinion. When it disagrees with the arrow, the cleanest choice is usually to skip the trade.
Setting Up the Script
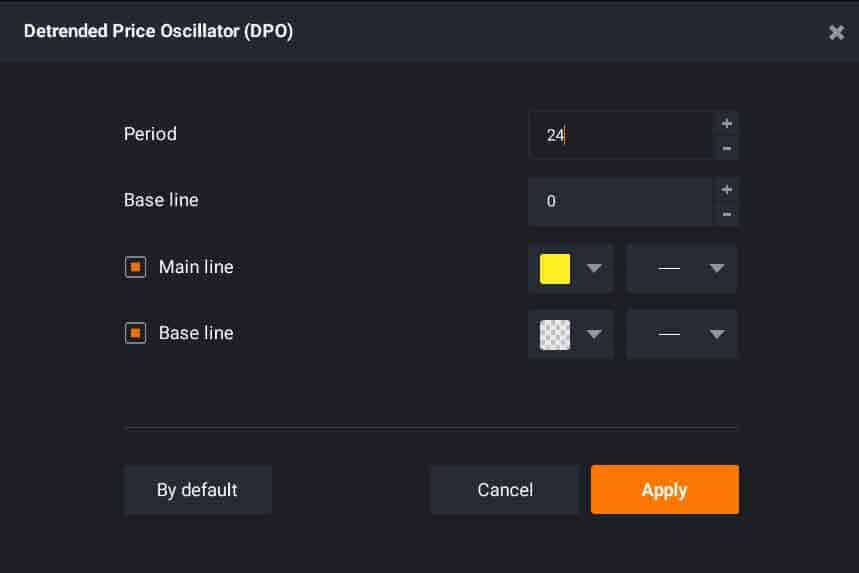
The script exposes a period setting that controls how wide a range it measures before calling a break. Lower values react quickly and flag more breakouts, but a larger share are false. Higher values react slowly and flag fewer, but more considered, breaks. Test a small set of period values — for example 13, 22, and 30 — on a demo account and watch how each behaves on the pairs you trade. There is no single "correct" number; it depends on the pair, the session, and how much noise you will sit through. Keep the chart clean, trade a few liquid pairs you know well, and let each candle finish before you act on the flag.
Entry Logic in Practice
A workable routine: the script flags a break above resistance, you wait for that candle to close beyond the level, you confirm the move has real momentum, and only then consider a trade in the breakout's direction. If price is stuck in a tight range, if the candle closes back inside the level, or if your confirmation tool disagrees, you stand aside — skipping weak setups is what keeps a breakout approach workable over time.
When the Script Fails
Be honest about where this tool struggles. Ranging, low-volatility markets produce a stream of false breakouts. Major news releases cause violent spikes that trigger the flag and then reverse just as fast. And chasing a breakout after it has already run often means buying right before a pullback. No script removes losing trades, so money management is the real edge. Stake only a small, fixed fraction of your balance per trade, cap how many trades you take in a session, and stop for the day at a preset loss limit. Practise the routine on a demo account until the reads feel automatic before you risk real funds. To compare approaches, see our IQ Option 1 minute strategy, the broader IQ Option Script guide, and our notes on IQ Option indicator settings.
FAQ
Does the Breakout Script guarantee the move will continue?
No. The script flags where price has pushed past a level, but false breakouts are common, especially on a one-minute chart. It is decision support, not a promise. Confirm the break with a candle close and momentum, and manage risk on every trade.
What period setting should I use?
There is no universal best value. Lower periods react faster but flag more false breaks; higher periods are slower but more considered. Test a few values on a demo account against the pairs you trade and pick what fits your style. Every indicator on the site is included with a single $39 lifetime plan.
Why do so many breakouts fail?
Markets range more than they trend, and inside a range price constantly tests its edges without truly breaking out. A momentary poke past a level looks like a breakout but is often just a test. Waiting for confirmation and avoiding flat markets sidesteps the weakest signals.
This content is for educational purposes only. Trading involves risk. Past results do not guarantee future outcomes. Always practice responsible money management and limit your daily trades to avoid large losses.