IQ Option Buy Sell Alerts v2 – What This Script Actually Does
The IQ Option Buy Sell Alerts v2 script is a chart overlay that plots buy and sell arrows based on a blend of RSI (Relative Strength Index), ADX (Average Directional Index), and simple trend analysis. Compared with a basic version, v2 uses shorter indicator lengths so that arrows appear sooner as momentum shifts. It is a visual aid for spotting potential reversals and continuation points — not an automated trading system, and not a promise of any particular outcome.
Key Features
- Faster signal generation – shorter RSI and ADX lengths react more quickly to price changes than the standard 14-period defaults.
- Hidden divergence detection – flags hidden bullish and bearish divergences that can hint at trend continuation.
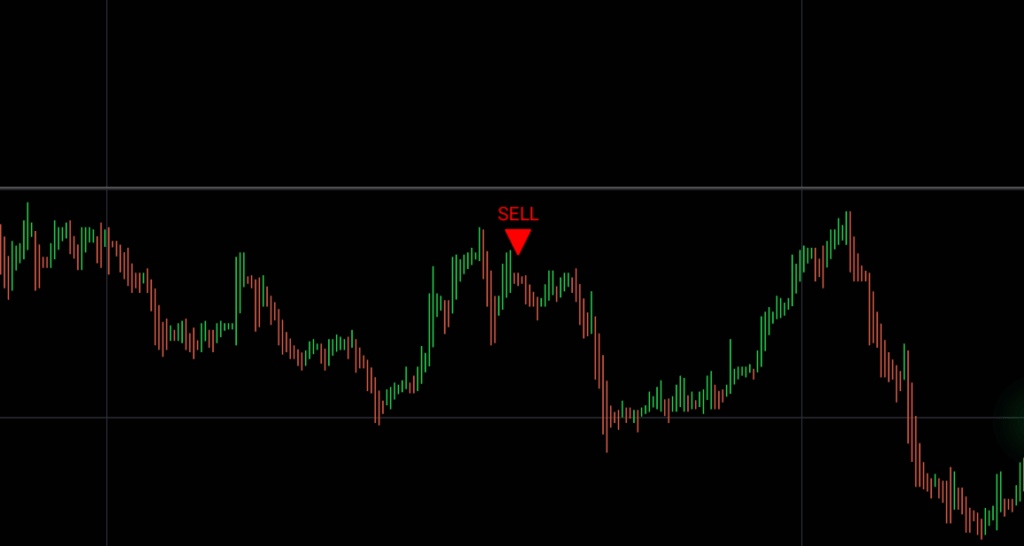
- Clear visual alerts – a green triangle (▲) marks a possible buy below the candle; a red triangle (▼) marks a possible sell above it.
The Repaint Caveat — Read This First
This is the single most important thing to understand about arrow and signal scripts: they can repaint. Repainting means an arrow that appears mid-candle can move, change colour, or disappear entirely once that candle closes and the next one forms. The script recalculates its RSI, ADX, and divergence conditions on every new tick, so a "buy" you saw thirty seconds ago may not be there when the bar completes.
Why does this matter? Because a chart full of arrows always looks convincing in hindsight — the ones that were wrong have already vanished. If you enter the moment an arrow flashes, you are acting on a signal that is not yet confirmed. The honest way to use any repainting tool is to treat a live arrow as a prompt to look closer, never as a finished instruction. Judge the tool by how it behaves on live candles, not by how clean the history looks.
Timeframe and Entry Rules (With Confirmation)
Because of the repaint issue, confirmation is not optional — it is the whole strategy. A few practical rules:
- Wait for candle close. Only act on an arrow that is still present after the candle it appeared on has fully closed. This alone filters out most disappearing signals.
- Pick one timeframe and stick with it. The 1–5 minute charts generate the most arrows, but also the most noise. Higher timeframes give fewer, steadier signals.
- Add an independent filter. Confirm the arrow's direction against a moving average, support/resistance level, or an oscillator such as the DeMarker before considering an entry.
- Trade with the trend. Counter-trend arrows in a strong move are the most likely to repaint away. If you want a full framework, see our IQ Option 1 minute strategy.
How to Load It on IQ Option
- Open IQ Option and go to the Indicators section.
- Choose Scripts and paste the provided code.
- Adjust display settings (colours, line width) if you wish.
- Apply it to your chart and observe how the arrows behave on closed candles before risking anything.
For a comparison with the original version and other configuration ideas, the IQ Option best indicator settings guide is a useful companion.
Realistic Expectations
No indicator predicts the market, and this one is no exception. It compresses several conditions into one arrow, which makes decisions faster but also hides the underlying uncertainty. Some arrows will be followed by the move you hoped for; others will not. Expect losing trades as a normal part of using it, and size every position so that a string of losses does not damage your account.
Risk Management
Always define a stop-loss before you enter, and never move it further away to avoid taking a loss. Risk only a small, fixed percentage of your balance per trade so no single signal can hurt you badly. Avoid martingale-style position increases after losses — doubling down to "recover" is one of the fastest ways to blow up an account, not a strategy. Test the script on a demo chart until you understand its repaint behaviour, and only then consider small live positions.
Does this script win every trade?
No. No script wins every trade, and any tool that claims to is not being honest with you. The v2 script highlights possible setups; you still take losses, and the goal is disciplined risk management, not perfection.
Does the script repaint?
Yes, like most arrow/signal scripts it can repaint — arrows may move or disappear as new candles form. The practical fix is to wait for the candle to close and confirm the signal with an independent indicator before acting.
What timeframe works best?
There is no single "best" timeframe. Lower charts (1–5 min) give more signals but more noise and more repainting; higher timeframes give fewer, more stable arrows. Choose one that matches your patience and test it thoroughly.
This script is included with the full toolkit if you want to try it alongside our other indicators — see pricing for $39 lifetime access.
This content is for educational purposes only and is not financial advice. Trading involves substantial risk; you can lose some or all of your capital. No result is guaranteed and past performance does not indicate future results. Trade only what you can afford to lose.