IQ Option Hi Low Bands + KDJ on a 10-Second Chart
IQ Option lets you drop the chart down to a 10-second timeframe, and this strategy pairs two indicators on it: Hi Low Bands and the KDJ oscillator. The bands give a visual read on where price is stretched while the KDJ tries to time the turn. Before anything else, set expectations honestly: a 10-second expiry is the least forgiving timeframe there is. Signals appear and expire in the time it takes to read them, and no indicator setting removes that pressure. Treat what follows as a framework to study on a demo account, not a shortcut.
What the KDJ Oscillator Measures
KDJ is a momentum oscillator derived from the same stochastic calculation you may already know, but it adds a third line. The K and D lines behave like a fast and slow stochastic, measuring where the current close sits in the recent high-low range. The J line is what makes KDJ distinctive: it runs ahead of K and D, so it reacts first. That sensitivity cuts both ways — the J line gives early warning when momentum is turning, but it also produces noisy, false flips, especially on a 10-second chart where a single tick can swing it. Read it as a hint, and wait for K and D to agree.
What Hi Low Bands Measure
Hi Low Bands plot a channel around price built from recent highs and lows, with a middle line running through the centre. The upper and lower bands act as dynamic support and resistance: when price pushes into the upper band it is stretched to the top of its recent range, and to the bottom at the lower band. The middle band is the reference — price above it leans bullish for the moment, price below it leans bearish. The bands do not predict anything on their own; they describe where price sits in its recent range so you can judge whether a move is early or already extended.
Recommended Settings
Configure the indicators:
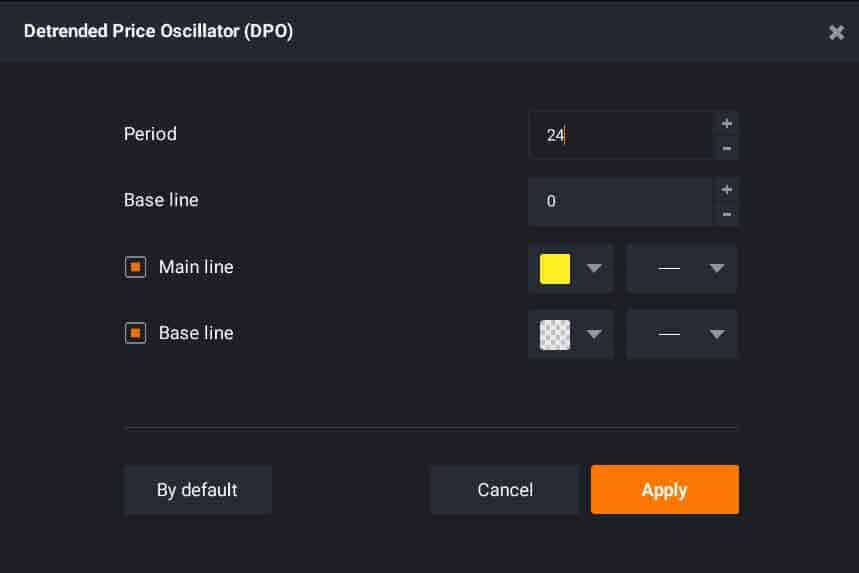
- Hi Low Bands — Period: 12, Percent Shift: 1
- KDJ — Period: 10, Signal: 4, Smoothing Factor: 4, Overbought level: 80, Oversold level: 20
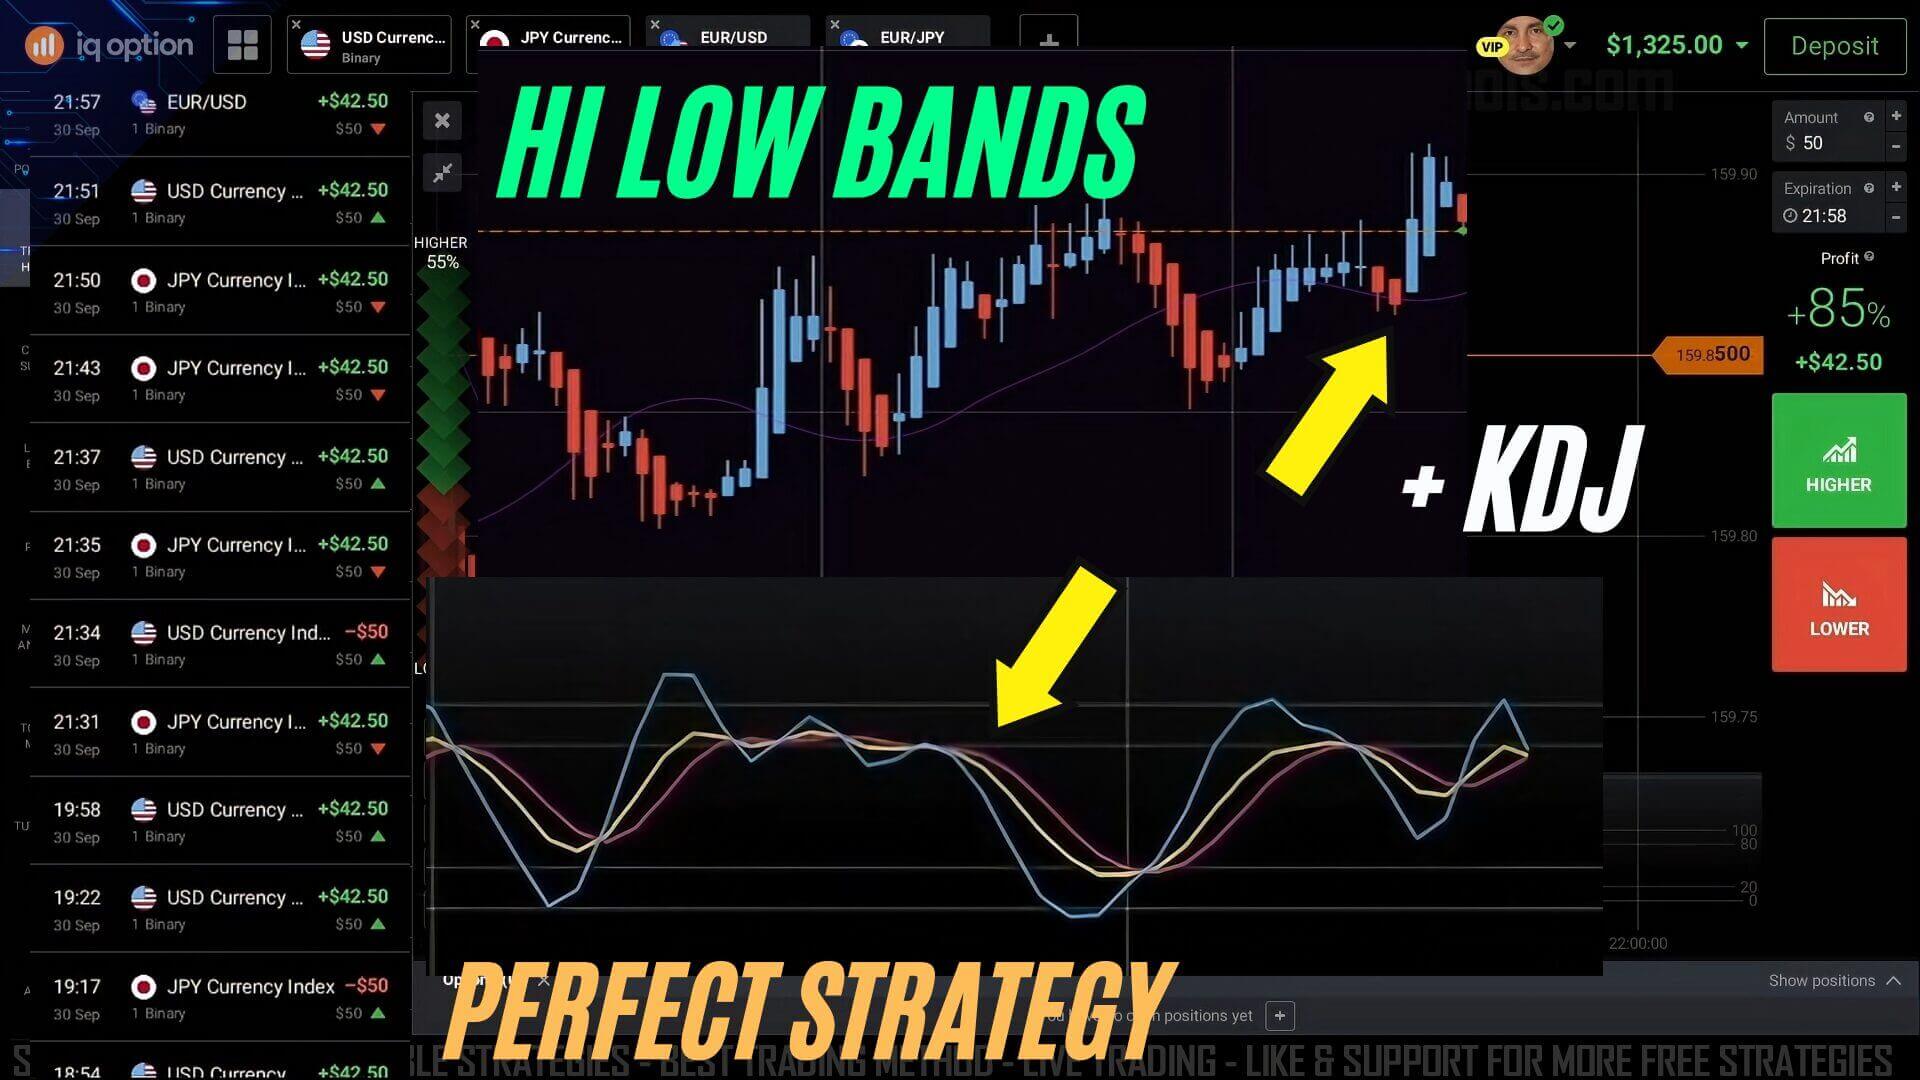
This setup is often shown on IQ Option's currency indices, such as the USD and JPY indices, but the same indicators apply to standard currency pairs. Keep the chart clean so the bands and KDJ lines stay readable, and let each candle close before you act on it.
Reading a Possible Entry — and When It Fails
- Possible put (down): price is trading near or above the upper band while the three KDJ lines converge out of overbought territory and start to roll over, and a red candle confirms the turn.
- Possible call (up): the mirror image — price near the lower band, the KDJ lines converging out of oversold and turning up, confirmed by a green candle.
- When it fails: in a strong trend, price can ride the upper or lower band for many candles while the KDJ stays pinned in overbought or oversold. Fading that band is how these setups lose. The J line's early flip is the biggest trap — it can signal a reversal that never arrives. If the bands are flat and price is chopping around the middle line, there is no edge, so stand aside.
Risk Management and the Demo Account
Because the timeframe is so fast, risk control matters more than the entry itself. Stake a small fixed fraction of your balance on each position, cap how many trades you take in a session, and set a hard daily loss limit. Never chase a loss by increasing your stake — raising the size after a losing trade is how small drawdowns become large ones. Losing trades are a normal part of short-expiry trading. Practise the whole routine on an IQ Option demo until the reads feel automatic before you risk real money.
To compare this against slower, less punishing approaches, read the IQ Option 1 minute strategy, browse tested IQ Option indicator settings, or see how an IQ Option script can automate part of the workflow.
FAQ
Is a 10-second chart a good place to start?
For most people, no. The 10-second timeframe reacts to noise as much as to real moves, and the short expiry leaves little room to be wrong. Learn the Hi Low Bands and KDJ combination first on a longer timeframe and a demo account where mistakes cost nothing.
What do the KDJ lines actually tell me?
K and D show where price sits in its recent range and how that reading is trending, while the faster J line tries to flag the turn early. Because J flips often on a 10-second chart, treat an early J move as a warning to watch, not a signal on its own — wait for K, D, the bands and the candle colour to agree.
Do I need to buy anything to try this?
You can add Hi Low Bands and a KDJ oscillator on IQ Option and test the idea for free on a demo account. The wider indicator library used across these guides is bundled in a single $39 lifetime plan, but nothing here requires a purchase to practise the method.
This content is for educational purposes only. Trading involves risk. Past results do not guarantee future outcomes. Always practice responsible money management and limit your daily trades to avoid large losses.