Detecting Trend in IQ Option
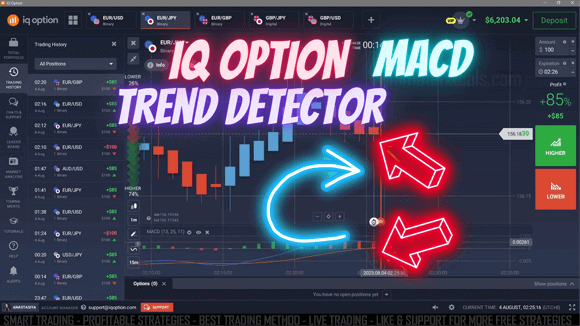
Reading the direction of the market is one of the first skills a discretionary trader tries to build, and it is rarely as simple as it looks on a finished chart. This method pairs two tools to help you judge whether price is trending or drifting sideways: the Smart Trade indicator for a broad read on market flow, and the Moving Average Convergence Divergence (MACD) for momentum. Neither is a crystal ball. Used together, they aim to give you a clearer picture and a checklist you can follow, rather than a set of promises.
The Smart Trade indicator studies conditions such as price movement and recent swings, then draws that context onto a small MetaTrader 4 sub-window with pop-up alerts. It is meant to help you visualise the wider situation so your decisions are based on a plan instead of a snapshot. Because IQ Option charts do not host custom MetaTrader tools directly, most traders run these indicators on an MT4 chart of the same asset and use the reading as reference alongside their IQ Option screen.
How the MACD reads momentum
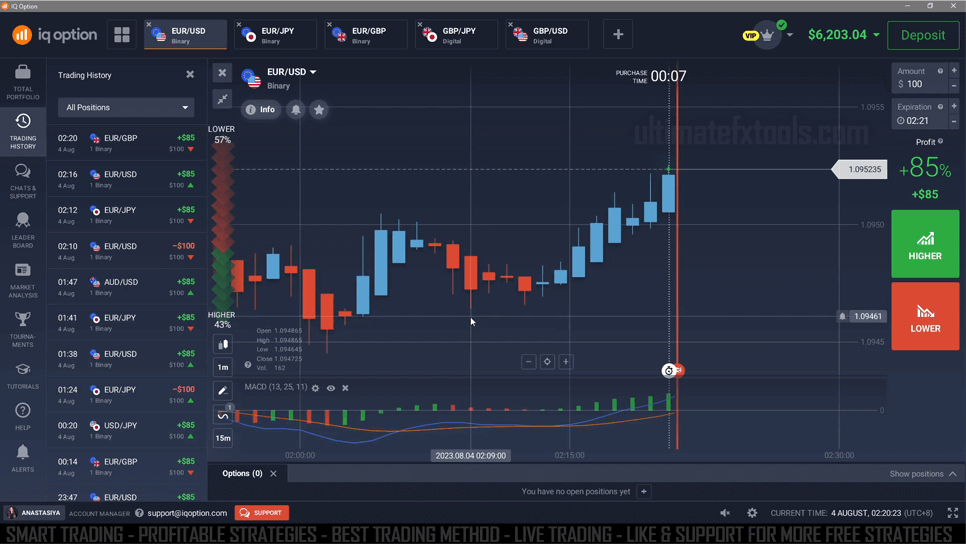
The MACD is a trend-following momentum indicator that shows the relationship between two moving averages of an asset's price. It triggers a signal when the MACD line crosses above its signal line (a possible buy bias) or below it (a possible sell bias). The distance of the histogram from the zero line hints at whether bullish or bearish pressure is strengthening or fading. That is genuinely useful for confirming a move, but it comes with a well-known limitation: the MACD lags. It is built from moving averages, so it reacts after price has already turned. In choppy, range-bound conditions the crossovers whip back and forth and produce false signals. Treating every crossover as an entry is the fastest way to get chopped up.
This is exactly why the two tools sit better together than apart. The Smart Trade reading gives you a directional bias, and the MACD is used only to confirm momentum in that same direction. When they disagree, the sensible answer is usually to wait rather than to force a trade.
Smart Trade Indicator:

Settings, Timeframe and Entry Rules
The MACD default of 12, 26, 9 is a reasonable starting point and there is no need to over-optimise it. Faster settings react sooner but generate more noise; slower settings smooth the noise but lag further. Rather than hunting for a magic number, keep one configuration and learn how it behaves on the pairs you actually watch. For short-term IQ Option trades, the 1-minute and 5-minute charts are common, though lower timeframes are noisier and demand tighter discipline. If you want a companion setup, the IQ Option indicator settings guide and the 1-minute strategy walk through related configurations.
A simple, non-guaranteed checklist looks like this:
- Confirm the Smart Trade reading points to a clear direction, not a flat range.
- Wait for the MACD crossover to agree with that direction.
- Prefer signals that appear away from obvious support or resistance where reversals are likely.
- Skip the setup entirely when the market is ranging and the MACD is hugging the zero line.
Realistic Expectations
No indicator combination removes uncertainty. Some signals will fail, sequences of losses happen, and no setting produces a fixed outcome. The goal here is consistency of process, not a promise of results. Test the method on a demo account first, keep a record of what works on your chosen assets, and only trade money you can genuinely afford to lose.
Risk Management
Because false signals are unavoidable, position sizing is what keeps you in the game. Risk only a small, fixed fraction of your balance on any single trade so a losing streak does not wipe out your account. Decide your exit before you enter, and accept the loss when the market disagrees with you. Avoid martingale-style recovery systems that double the stake after each loss; they can escalate a normal drawdown into a total loss very quickly and are not a substitute for a plan. If you want the full toolkit behind these strategies, our indicators are available for a one-time $39 lifetime purchase with no subscription.
Frequently Asked Questions
Does this method win every trade?
No. Nothing on the chart wins every trade. The MACD lags and can produce false signals in sideways markets, so losses are part of the process. The aim is a repeatable, disciplined approach — not a guaranteed outcome.
What timeframe works best?
There is no single best timeframe. Many short-term traders use the 1-minute or 5-minute charts, but lower timeframes carry more noise. Test a couple on a demo account and keep the one that fits your patience and schedule.
Can I use MACD on its own?
You can, but on its own the MACD is prone to whipsaws in choppy conditions. Pairing it with a directional read like the Smart Trade indicator is meant to filter some of those weaker signals, though it never eliminates them.
Trend Detector MACD IQ Option Method Walkthrough
This content is for educational purposes only and is not financial advice. Trading involves substantial risk; you can lose some or all of your capital. No result is guaranteed and past performance does not indicate future results. Trade only what you can afford to lose.