Pocket Option Long Heiken Ashi Candle
The long Heiken Ashi candle is one of the few short-term chart signals that is readable at a glance. On a fast Pocket Option chart, where the decision has to be made in seconds, a candle that suddenly prints far longer than the ones around it says something specific: one side of the market pushed hard, and pushed in a hurry. This page covers what that candle represents, how to trade the extension it creates, and the conditions in which the setup stops working. No candle pattern wins every trade, and this one is no exception.
What Heiken Ashi Candles Actually Smooth
Standard Japanese candles plot raw prices: each candle's open, high, low and close are exactly what the market did in that period. Heiken Ashi candles do not. They are a calculated average. The close is the average of that period's open, high, low and close, and the open is the midpoint of the previous Heiken Ashi candle's open and close. That second part is the key: every candle inherits from the one before it, which is why Heiken Ashi bodies chain together instead of jumping around.
The practical effect is a filter. Small counter-moves that would print a red candle on a normal chart often stay green on Heiken Ashi, because the averaging absorbs them. A run of same-colour bodies with little wick on the opposing side reads as a trend still intact; wicks on both ends and shrinking bodies read as a trend losing conviction. You give up precision — the Heiken Ashi close is not the real market price — in exchange for a cleaner read of direction. On a 5-second chart, where raw candles look like static, that trade-off is worth making.
What a Long Candle Signals About Momentum
Because Heiken Ashi bodies are averaged, a body that stretches well beyond its neighbours is unusual: raw price moved far enough in one short window that the smoothing could not hide it. That is a burst of one-sided pressure — a stop run, an order-flow imbalance, or thin liquidity on an OTC pair. Bursts like that are, by nature, temporary. Price rarely sustains that pace, and the candle after an outsized body often gives part of it back as the move mean-reverts. That short retraction is the opportunity here: you are not trading the burst, you are trading the exhaustion that tends to follow it.
How the Strategy Works
Set the candle time period to 5 seconds and switch the chart to Heiken Ashi candles. The 5-second period is what makes the setup visible — on a 1-minute chart the same burst is averaged into an ordinary candle and you never see it.
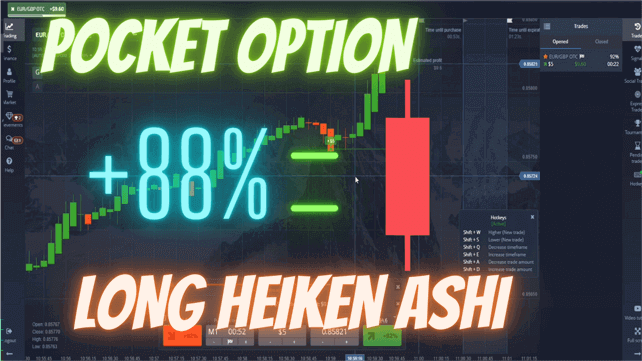
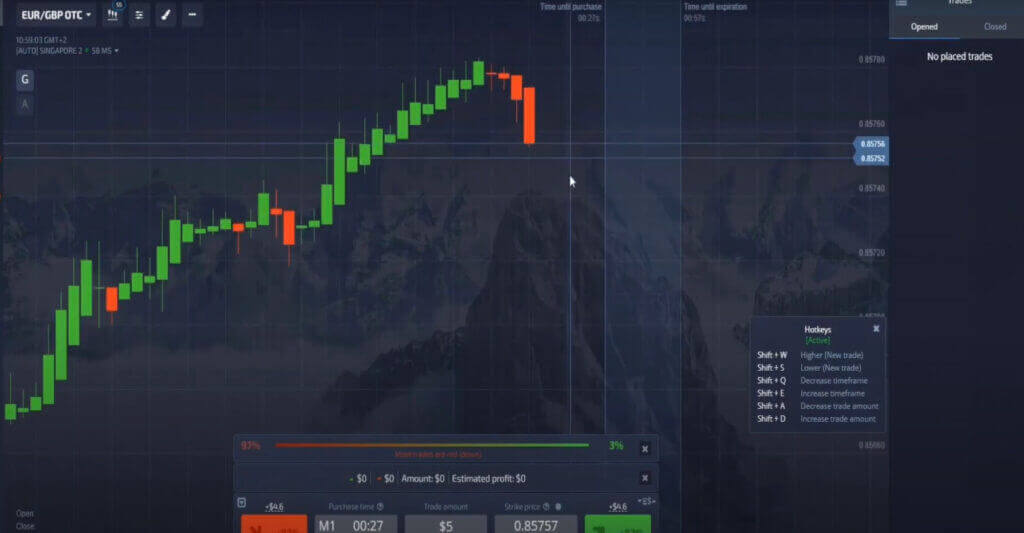
Watch for a trend that is already running, then wait for a single 5-second candle to print a body clearly longer than the recent average. In the chart below the trend is heading up and two of these long extensions appear. Each one marks a short, sharp stretch away from the recent range, and each one is followed by a retraction — which is why the entry is taken in the opposite direction to the long candle, not with it.
Setup and Entry Rules
- Chart: Pocket Option, Heiken Ashi candle type, 5-second candle time period.
- Trade expiry: keep it short and proportional to the candle — a handful of candles, not minutes. The retraction you are trading resolves quickly or not at all.
- PUT / down: an established up-move prints one abnormally long green Heiken Ashi body. Enter down as that candle closes and the next one opens, expecting the give-back.
- CALL / up: the mirror image — an abnormally long red body during a down-move, entered up.
- Stand aside: no clear preceding trend, several long candles in a row (that is a real move, not an exhaustion spike), or bodies that are all roughly the same size — nothing has stretched, so there is nothing to snap back.
The judgement call is "abnormally long", and it is relative, not absolute. Watch a pair for a few minutes before trading it so you know what its normal 5-second body looks like. A long candle on a quiet pair and a long candle on a fast one are not the same event.
Confirmation and Filters
The long candle alone is a thin reason to trade. Two filters help. First, direction: only fade a spike inside a trend that is otherwise healthy, rather than standing in front of a genuine reversal. Second, volatility context — a measure such as Average True Range tells you whether the candle is long because the market is genuinely stretched or simply because everything is long right now; that combination is covered in the 5 Seconds Heiken Ashi with Average True Range guide. If you want colour changes to be more obvious while you learn the pattern, the Colored Heiken Ashi indicator makes trend flips easier to read on the MetaTrader side.
When This Setup Fails
The failure modes are predictable, so be honest about them. In a choppy, rangebound market long candles appear constantly in both directions and mean nothing — the "spike" is noise, and fading it repeatedly bleeds an account. During news releases the burst is not exhaustion at all; it is repricing, and price keeps going, so a counter-trend entry sits on the wrong side of a real move. On thin OTC pairs, spread and execution delay can eat the small retraction before the trade resolves. And in a strong, accelerating trend, the long candles are the trend, not an anomaly.
Risk management is what carries you through those stretches: a small fixed stake per trade, a cap on trades per session, and a stop-for-the-day loss limit set before you start. Practise on a demo account until you can identify a genuinely abnormal candle without hesitating — the setup depends entirely on that judgement. A slower variant of the same logic is worth studying too: the Quotex 30-Second Heiken Ashi and Dual Supertrend method uses a trend filter instead of raw candle size.
Pocket Option Heiken Ashi Long Candle Strategy
FAQ
Why enter against the long candle instead of with it?
Because the long candle is evidence the move has already happened. Heiken Ashi smoothing means a body only stretches that far when raw price ran hard in a few seconds, and that pace is difficult to sustain. The setup fades the exhaustion. It is not a rule that holds every time — if the burst is news-driven, price will keep going and the entry fails.
Can I use a different candle time period?
The 5-second period is what the strategy is built on, because it is short enough for a single burst to stand out as an outlier. On longer periods the same movement gets averaged into an unremarkable candle and there is nothing to spot. If 5 seconds feels too fast to read, practise on a demo account rather than stretching the timeframe.
Do I need an indicator for this?
No — the candle type and the time period are the whole setup, which is why it suits traders new to fast charts. Indicators help with filtering rather than the signal: a volatility reading for context, or a coloured Heiken Ashi build for a clearer trend read. Those tools are included in the single $39 lifetime plan if you want them, but the base method works on a plain chart.
This content is for educational purposes only. Trading involves risk. Past results do not guarantee future outcomes. Always practice responsible money management and limit your daily trades to avoid large losses.