Pocket Option Four-Indicator Strategy: RSI, CCI and Two EMAs
This Pocket Option setup puts four tools on a single chart: the Relative Strength Index (RSI), the Commodity Channel Index (CCI), and two Exponential Moving Averages. The appeal is obvious: if several indicators point the same way, the signal feels stronger. Before you crowd a chart with four lines, though, it is worth asking an honest question — are these four tools measuring four different things, or the same thing more than once?
Do four indicators really mean four confirmations?
Not automatically. RSI and CCI are both momentum oscillators. They measure closely related ideas — how stretched price has become versus its recent average — so in practice they tend to reach their extremes at roughly the same time. When RSI reads oversold, CCI is usually oversold too. That is not two independent votes; it is largely one reading expressed twice. The two EMAs are the genuinely different piece: a faster average and a slower average form a crossover system that tracks trend direction rather than momentum extremes. So this “four-indicator” method is really two families — one momentum read (RSI plus CCI, which mostly agree with themselves) and one trend read (the EMA crossover). Knowing that stops you from mistaking two oscillators nodding along for real confirmation, and it shows where the actual filter lives: in whether the trend and momentum tools agree.
What each indicator actually measures
- RSI — a momentum oscillator on a 0–100 scale that flags overbought and oversold conditions.
- CCI — also a momentum oscillator; it gauges how far price has strayed from its statistical mean. It overlaps heavily with RSI, so treat the two together as a single momentum opinion.
- Fast EMA and Slow EMA — the crossover shows the prevailing direction and the moment it may be shifting. This is the complementary layer that the oscillators cannot give you on their own.
Recommended Settings
These are the values used in the walkthrough. Treat them as a starting point and test them on a demo chart first:
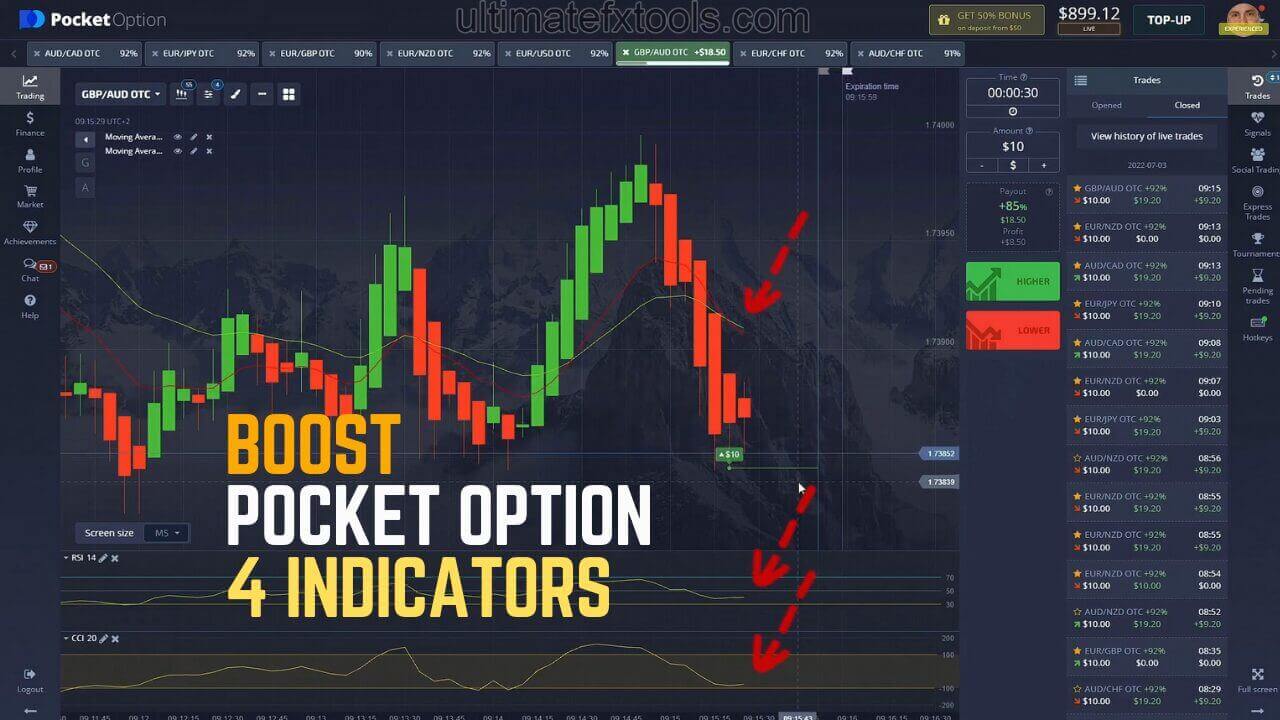
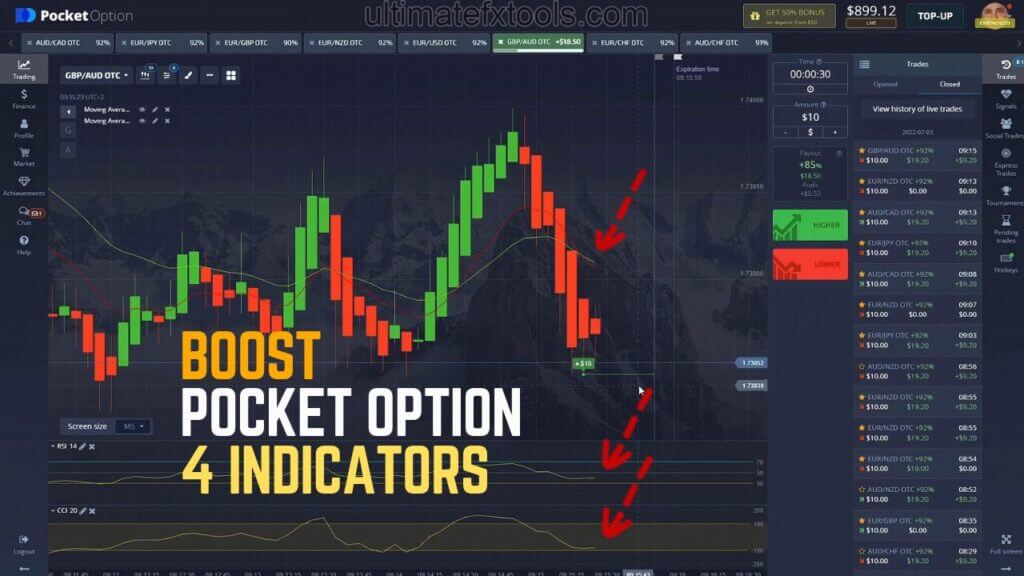
- RSI with a period of 14
- CCI with a period of 20
- Exponential Moving Averages with periods of 12 and 23
Entry Logic and Setup
Because RSI and CCI move together, count them as one filter, not two. The setup you want is when that combined momentum read and the EMA crossover line up in the same direction:
- Up trade (call): RSI and CCI both turn up out of their lower bands while the fast EMA crosses above the slow EMA. A reversal candle forming off a swing low adds context.
- Down trade (put): RSI and CCI both roll over from their upper bands while the fast EMA crosses below the slow EMA, with price failing under recent resistance.
- Stand aside: the oscillators and the EMA crossover disagree, or price is stuck flat with no clear direction. A conflicting reading is information too — it usually means wait.
This kind of reversal read fits short expiries. If you are still building a feel for one-minute timing, the best 1-minute strategy in Pocket Option walks through the mechanics, and live Pocket Option trading using momentum shows how a momentum read behaves in real conditions.
When This Setup Fails
The weakness is baked into the design. In a quiet, ranging market the oscillators whip between overbought and oversold every few candles, firing signals that go nowhere, while the EMA crossover lags and flips late. Because RSI and CCI agree with each other, a false momentum reading is not corrected by the “second” oscillator — both are wrong at once. That is why the EMA crossover matters as the tie-breaker, and why skipping trades when the two families disagree does more for consistency than taking every signal. No indicator combination removes losing trades. Manage risk on every position: stake a small, fixed fraction of your balance, cap how many trades you take in a session, and stop for the day at a preset loss limit. If you are new to the platform, read what Pocket Option OTC is so you understand the market you are trading, and practise the rules on a demo account until the reads feel automatic.
FAQ
Is using four indicators better than using two?
Not necessarily. RSI and CCI are both momentum oscillators, so they largely repeat the same information. In effect this strategy has two independent inputs — a combined momentum read and the EMA trend crossover — not four. The value comes from how well the tools disagree, not from their number.
What timeframe and expiry suit this setup?
It is built for short-term reversal reads, commonly the one-minute chart with a matching short expiry. In choppier conditions, stepping up a timeframe filters out weak oscillator signals. Match the expiry to the timeframe you read the signal on rather than forcing a fixed number.
Do I need to pay to use this strategy?
No. RSI, CCI and EMAs are standard indicators available free in MetaTrader and on most charting platforms, so you can build this setup yourself at no cost. If you later want the full library of custom indicators and strategies in one place, the $39 lifetime plan covers everything on the site.
This content is for educational purposes only. Trading involves risk. Past results do not guarantee future outcomes. Always practice responsible money management and limit your daily trades to avoid large losses.