Pocket Option Super Trend Strategy Ultimatefxtools Indicators
Trading Pocket Options with the help of the major indicators provided by ultimatefxtools is what I have anticipated for this trading session. With this strategy, I am accumulating more gains than I am incurring losses. Ensure that you are trading on the minimal amount required for each trade. Avoid making a single trade that spends all of your funds available. It will be exactly the same as a disaster.
As may be seen in the chart, the following I based my expertise on three different indicators. The first one is the ultimate signal indicator. In response to which it generates an arrow to indicate a change in the trend. The arrow will repaint itself; but, in order to filter out the noise caused by the market fluctuations, we need other indicators. The ultimate stoch indicator is going to be the objective of our attention as we continue on to the next signal. This indicator makes use of its highest high and lowest low in order to provide the best possible algorithm for identifying trends in the market. The third one is the ultimate trend indicator. This indicator or oscillator will generate a line that will either be green or red depending on the color it generates. When the price reaches the green line, it indicates that it has reached the level of most resistance; when it reaches the red line, it indicates that it has reached the level of greatest support.
Okay, I'll simply wait for the arrow to point in the direction I want to go. provided that all of the other indicators are met. Have a look at the USD to JPY exchange rate. It has now reached the support level that both oscillators had been looking for. Moreover, it draws a red line on the ultimate trend indicator we have. We are going to wait for the arrow to appear. Let me check another currency pair that is going to be traded so that we can trade for another chance.
The exchange rate of AUD to USD produces a red arrow at the very top of our chart. After that, it reaches the upper level of our ultimate stoch indicator, at the same time as the green line is created by our ultimate trend indicator. We are going to trade for a lower AUD/USD rate.
However, the AUD USD is on a lower ROI, with a return on investment of 76 percent profit. What we will be trading has a profit margin of at least 80 percent.
Take a look. An arrow signal is produced by the AUD/CAD pair. The ultimate stoch oscillator eventually reach the level of resistance, at which point the ultimate trend produce a green line. Then we will attempt to trade for a lower price for this. My preference is to trade on the 2-minute time frame, but the decision is totally yours. I used the pocket option chart's 10-second timeframe for my trading experience by trading this strategy.
The AUD NZD pair meets its signal. Let us go for a down. On occasion, the currency pair that we will be dealing on the OTC market will not be the traditional one. A number of trading brokers engaged in market manipulation. Whether or not they configure the size of the lot. A delay was imposed on either the price action or any configurations.
Although we got a loss on the AUD/CAD pair, there are still other currency pairs from which we can profit more. Let us trade in accordance with this strategy. And make a profit on each every trade.
We got our profit.
The confirmation for CAD CHF has been received. There was evidence of all three indicators. We are now able to settle for less.
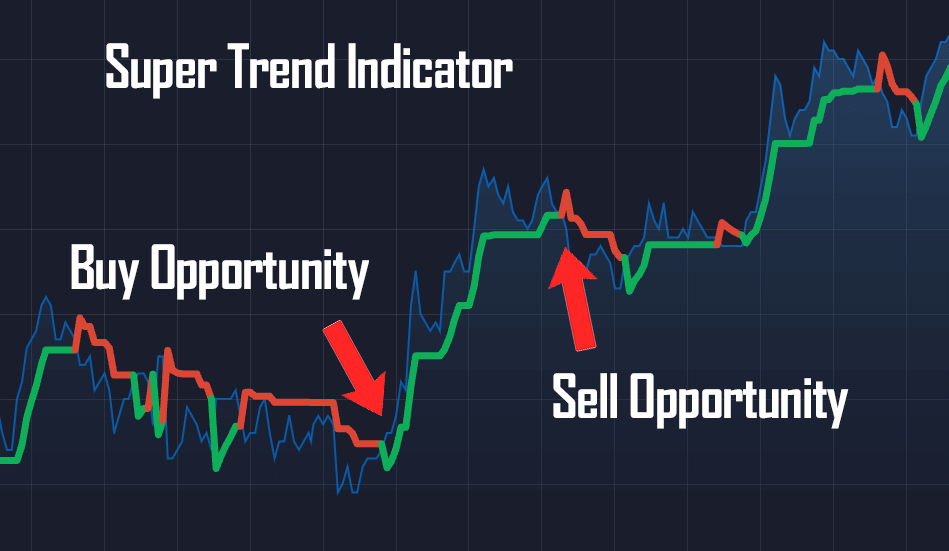
According to what the chart shows. In addition to that, I made use of the Super Trend Indicator for trend targeting and for determining the strength of the trend.
When trading with Pocket Option, be sure to like our page and subscribe to our channel to receive the most recent trading tactics and updates.
You may learn how to trade utilizing this method by watching the rest of the video.