Pocket Option Vortex Strategy
The Vortex indicator is one of the free tools built into the Pocket Option platform, which makes it a convenient starting point for traders who want a structured way to read trend direction and possible reversals. This guide walks through what the Vortex indicator actually measures, sensible settings and timeframes, a simple set of entry rules, and — just as importantly — the situations where the indicator struggles. The short video below demonstrates the setup on a live chart.
What the Vortex Indicator Does
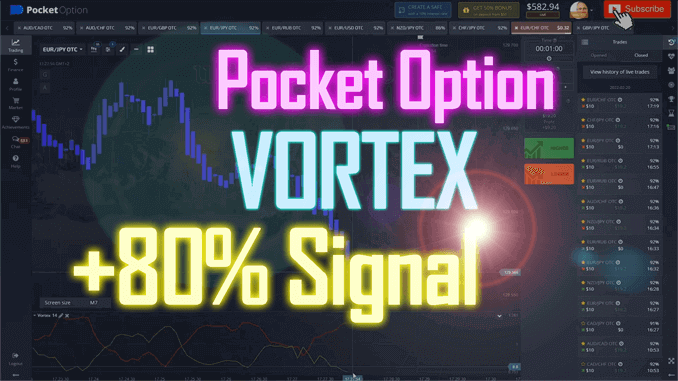
The Vortex indicator is built from two oscillating lines, usually labelled VI+ and VI-. VI+ tracks upward price movement and VI- tracks downward movement, both measured relative to recent trading ranges. When VI+ is above VI-, buying pressure has the upper hand; when VI- is on top, selling pressure dominates. The crossover between the two lines is the signal most traders watch, because it often lines up with a shift in short-term direction.

Because it is derived from price and range data, the Vortex is a trend-following tool at heart. It tends to read cleanly when a market is moving in one direction, and it tends to give conflicting or repeated crossovers when price is stuck in a tight range. Understanding that trade-off is the key to using it sensibly rather than treating every cross as a signal.
Is the Vortex Indicator Free on Pocket Option?
Yes. The Vortex indicator is included in the Pocket Option platform's built-in indicator list at no extra cost, so any account can add it to a chart without downloading anything. That accessibility is part of why it is a popular first indicator for newer traders learning to read trend and momentum.

Settings, Timeframe and Entry Rules
The default period of 14 is a reasonable starting point and is what is used in the walkthrough above. A longer period smooths the lines and produces fewer, slower signals; a shorter period reacts faster but whipsaws more. As a rough guide, some traders pair a 16 period with a 3-minute expiry and a 23 period with a 5-minute expiry, then adjust to the asset and their own testing rather than treating those numbers as fixed rules.
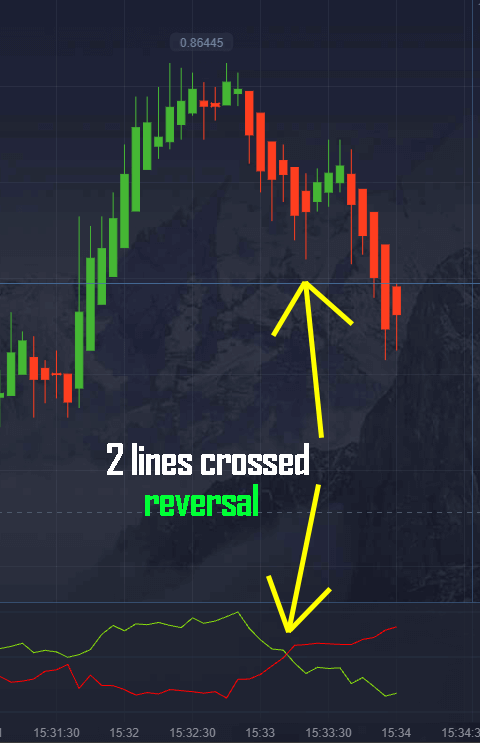
A basic approach looks like this: wait for VI+ and VI- to cross, and favour the direction of the crossover. Signals tend to be cleaner when the two lines separate widely after the cross, since that suggests conviction behind the move rather than indecision. Because the Vortex alone produces false crosses in choppy conditions, many traders confirm with a second tool such as Bollinger Bands, RSI, or a moving average before acting. If you like combining tools this way, our best 1-minute Pocket Option strategy shows a similar multi-indicator confirmation setup.
Realistic Expectations
The Vortex is a lagging indicator: it confirms a move after it has begun rather than predicting it, so entries can arrive a little late. In sideways or low-volatility markets it will whipsaw, firing crossovers that reverse almost immediately. No indicator removes that noise, and no combination of settings turns it into a signal that is right every time. Practising on a demo balance first is the sensible way to learn how it behaves on the assets you trade. For more foundational habits, see our Pocket Option tips for beginners.
Risk Management
Managing risk matters more than any single indicator. Decide in advance how much of your balance you are willing to risk on a trade — many traders keep this to a small fixed percentage — and stick to it even after a losing run. Avoid martingale systems that double stake size after a loss: they can wipe out an account quickly during a normal losing streak, and they are best treated as a warning rather than a strategy. Keep position sizes consistent, don't chase losses, and step away when conditions are unclear.
Frequently Asked Questions
Does the Vortex strategy win every trade?
No. No indicator or strategy wins every trade, and the Vortex is no exception. It lags price and whipsaws in ranging markets, so losing trades are a normal part of using it. The goal is a repeatable process paired with disciplined risk management, not a perfect signal.
What timeframe works best with the Vortex indicator?
There is no single best timeframe — it depends on the asset and your expiry choice. Shorter periods and timeframes react faster but produce more false signals, while longer ones are slower but steadier. Test a few combinations on a demo account and match the indicator period to the expiry you plan to trade.
Should I use the Vortex indicator on its own?
It is generally better to confirm Vortex crossovers with another tool such as RSI, Bollinger Bands, or a moving average. On its own the indicator produces false crosses in choppy conditions, so a confirmation filter helps you skip the weakest setups.
If you want a full library of indicators and strategies to build on, our complete toolkit is available on the pricing page for a one-time $39 lifetime payment.
This content is for educational purposes only and is not financial advice. Trading involves substantial risk; you can lose some or all of your capital. No result is guaranteed and past performance does not indicate future results. Trade only what you can afford to lose.