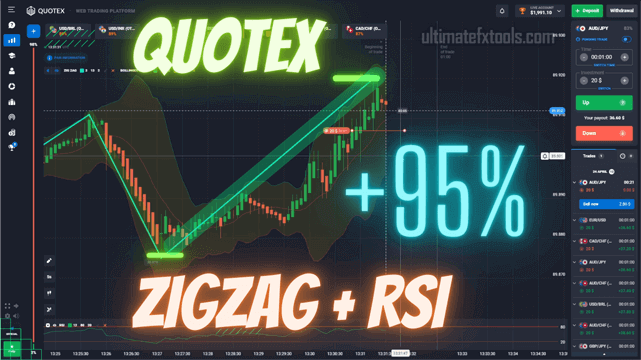
Search for the "best Quotex indicator" and you will find a hundred confident answers, but the honest one is that no indicator is best in the abstract. Every indicator measures a single thing well and says nothing about the rest, so the right tool depends entirely on the market condition in front of you. This Quotex strategy pairs two indicators that measure different things: the ZigZag, which maps swing structure, and the RSI, which times momentum. Read together they cover more of the picture than either does alone.
Is There a "Best" Quotex Trading Indicator?
The short answer is no. A momentum oscillator like RSI is useful when price is ranging and stretched, but it can stay pinned at an extreme through a strong trend. A structure tool like ZigZag shows where price turned, but only after the turn confirms. Calling any single one "the best Quotex indicator" ignores that each is built for one job. What works is combining a structure tool with a momentum tool, then trading only when the two agree.
How the ZigZag Indicator Works (and Why It Repaints)
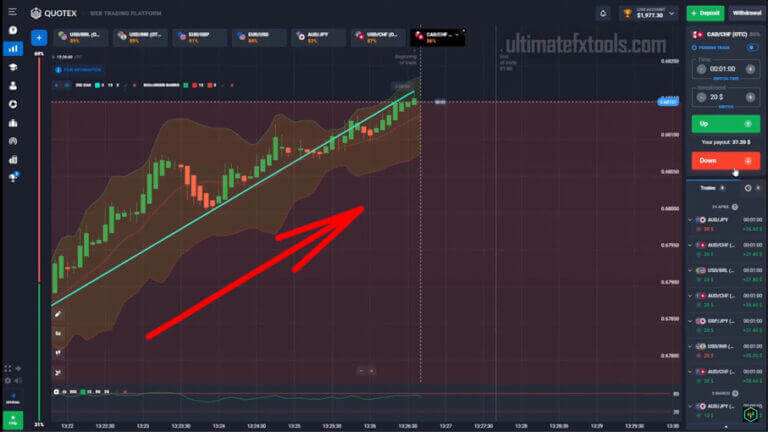
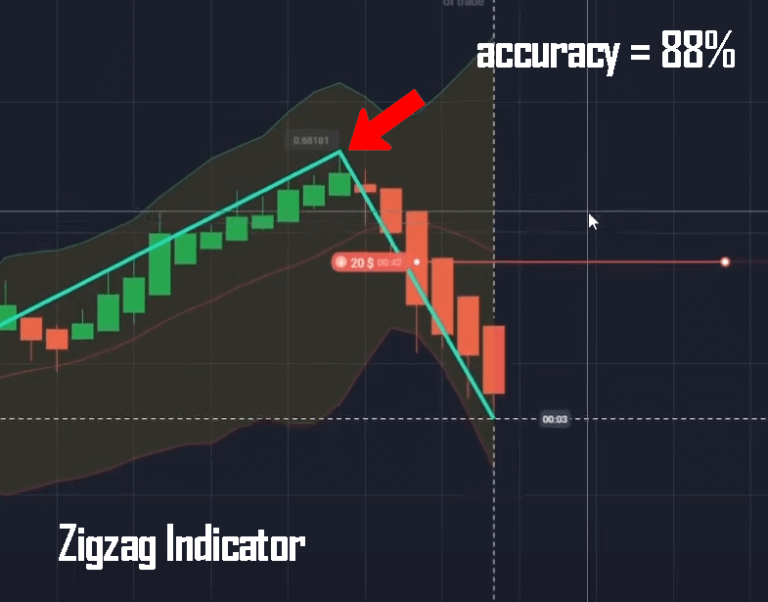
The ZigZag indicator filters out small price noise and connects the significant swing highs and swing lows with straight lines, leaving a clean map of recent market structure. Before you rely on it, understand one important caveat: ZigZag repaints. The most recent leg is always provisional. As long as price keeps moving, that last line can extend or redraw, and a swing point you thought was fixed can jump to a different candle. ZigZag only locks a swing once price has reversed far enough to satisfy its settings, so treat the current leg as a work in progress rather than a finished signal.
ZigZag Settings
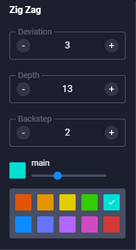
These parameters control how large a move must be before ZigZag draws a new leg. Larger values mean fewer, more meaningful swings:
- Depth – 13 — how many bars back the indicator looks before fixing a new high or low
- Deviation – 3 — the minimum move (in points) needed to start a new leg
- Backstep – 2 — the minimum bars between two swing points
How RSI Times the Entry
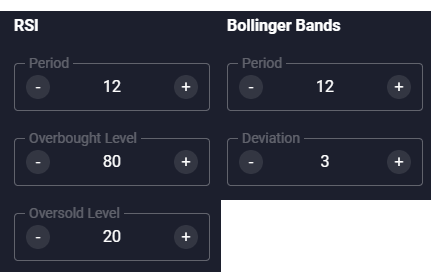
The RSI is a momentum oscillator that measures the speed and size of recent price changes on a 0–100 scale. Readings above the overbought level suggest the recent push higher may be stretched; readings below the oversold level suggest the same about a move down. RSI does not predict direction — it describes momentum, and momentum can persist longer than you expect, which is why it is used as a timing filter, not a standalone trigger. The settings for this strategy are Period 12, Overbought 80, Oversold 20. Some traders add Bollinger Bands (Period 12, Deviation 3) as an optional volatility filter to see when price is trading at a statistical extreme.
Putting the Two Together — Entry Logic
The pairing works because ZigZag marks where structure turned and RSI tells you whether momentum supports that turn:
- Up (buy / higher): ZigZag confirms a swing low and RSI is turning up from or below the oversold level (20).
- Down (sell / lower): ZigZag confirms a swing high and RSI is turning down from or above the overbought level (80).
- Stand aside: the ZigZag leg is still forming, or RSI sits in the middle of its range with no clear direction. Because the last ZigZag leg can repaint, wait for the swing to confirm before you commit.
Timeframe and Risk Management
This method is read on the 1-minute to 5-minute chart, matching the expiry to the timeframe you take the signal on. No indicator combination removes losing trades, so risk control matters more than any single setting: stake a small, fixed fraction of your balance per position, cap how many trades you take in a session, and stop once you hit a preset daily loss limit. Practise the rules on a demo account until the reads feel automatic before you risk real funds. The goal is consistency, not one big result.
Want more Quotex setups to compare? See the momentum-based Quotex 1 Minute Strategy, the beginner-friendly Quotex Easy Strategy, a trend-following take in the Donchian Channel and Schaff Trend Cycle guide, and the alert-driven Amazing Quotex Alert Signal method.
FAQ
Which is the best indicator for Quotex?
There is no single best indicator. Each one measures one thing — ZigZag reads structure, RSI reads momentum — so the useful question is which combination suits the condition you are trading. Pairing a structure tool with a momentum tool, as this strategy does, covers more ground than leaning on one indicator alone. Every indicator referenced here is included in the one-time $39 lifetime plan.
Does the ZigZag indicator repaint?
Yes. The most recent ZigZag leg is provisional and can redraw as new candles print, because the indicator only locks a swing once price has reversed far enough to meet its settings. Use it to read confirmed structure, not to call the current candle.
What timeframe works best for this strategy?
The setup is designed for the 1-minute to 5-minute charts on Quotex. Match your expiry to the timeframe you read the signal on, and in choppy conditions step up a timeframe to filter out weaker signals.
This content is for educational purposes only. Trading involves risk. Past results do not guarantee future outcomes. Always practice responsible money management and limit your daily trades to avoid large losses.


