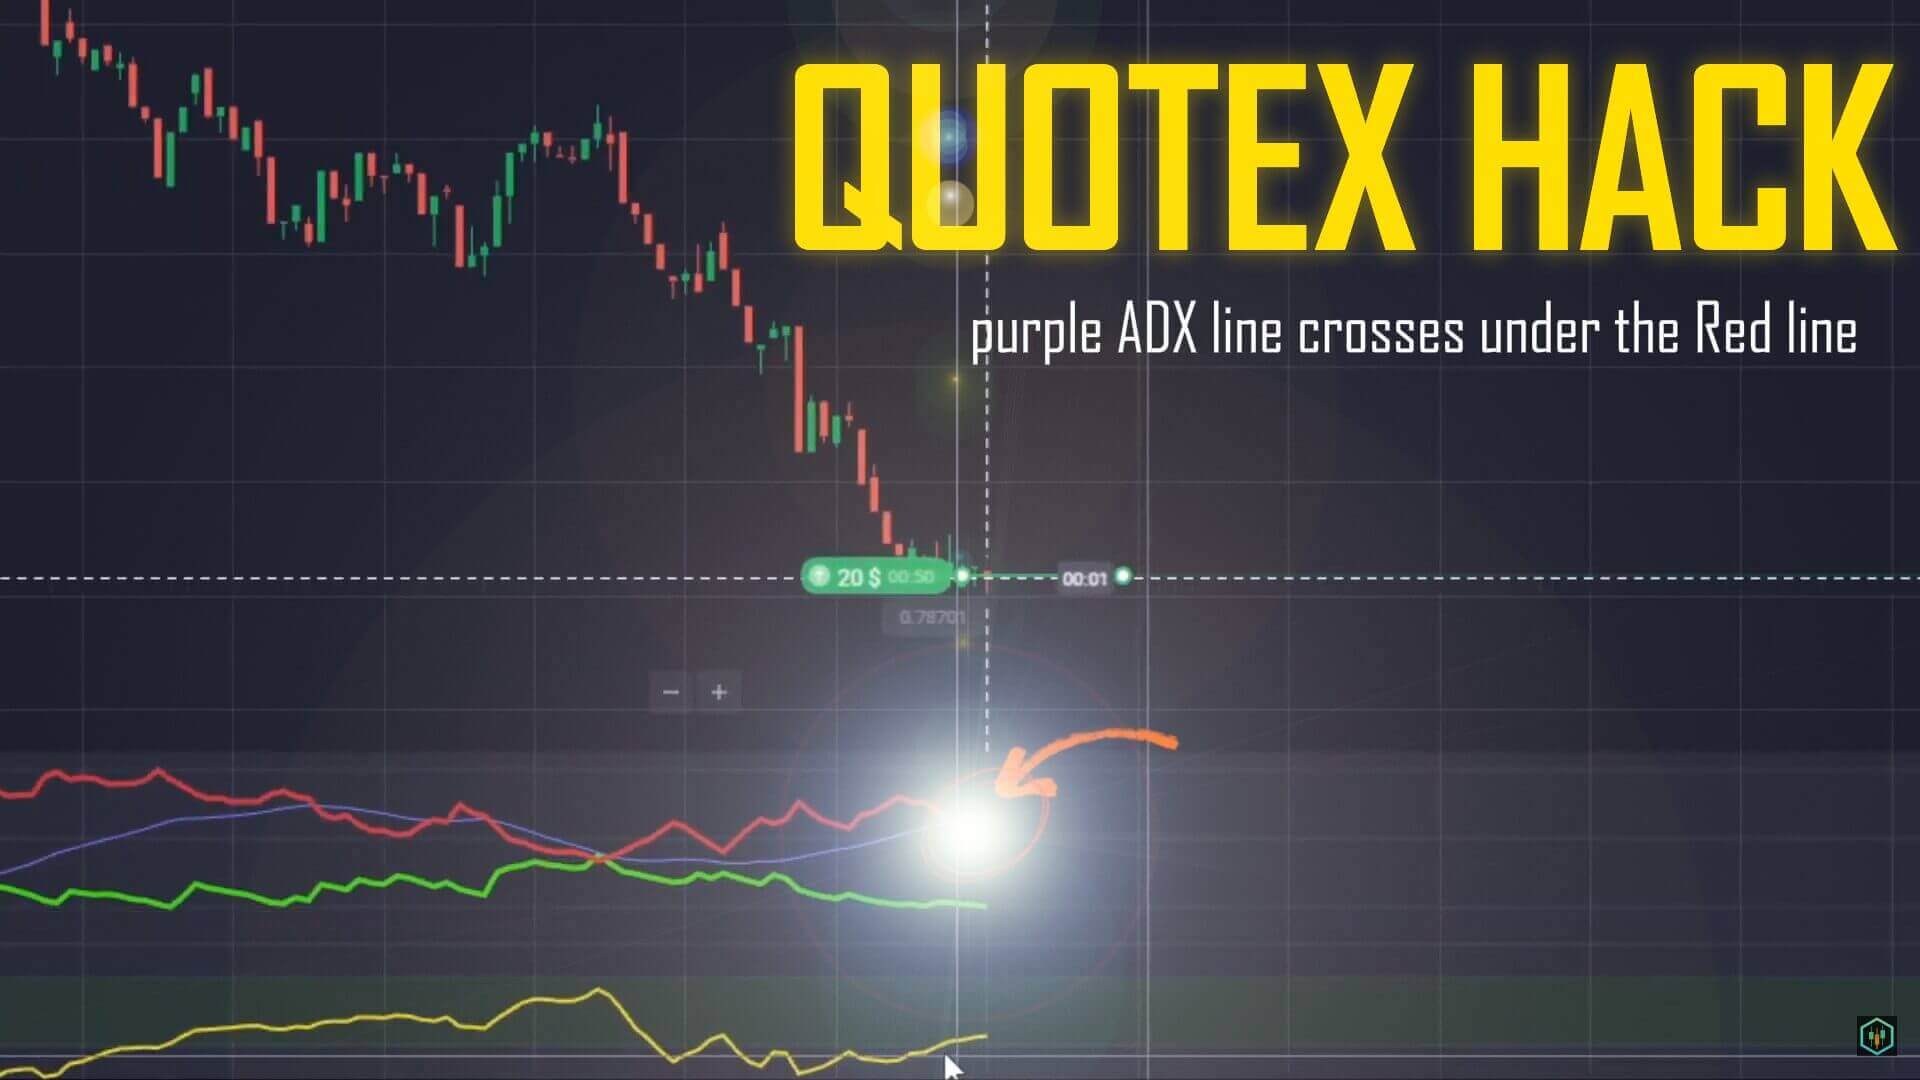
Quotex Trading Hack with ADX and CCI Indicators
The honest part first: “hack” here is a nickname, not a way to beat the platform. Nothing in this combination gives you an edge over Quotex itself, and no setup wins every trade. What the ADX and CCI pairing does is separate the oscillator readings worth acting on from the traps — on a one-minute expiry, that filtering is the whole job.
What the CCI Is Really Measuring
The CCI (Commodity Channel Index) answers one question: how far is price sitting from its own recent average? It compares each candle’s typical price to a moving average of that typical price, then scales the gap by how much price has typically deviated. That scaling makes the reading relative to the market’s own behaviour, so −150 means “unusually far below average for this market right now”.
That construction is also its weakness. The CCI is unbounded — it can print −200 and keep going to −400. Readings past ±100 are called extremes, but an extreme only describes distance; it never predicts a return. Treating “far from average” as if it meant “about to snap back” is the mistake that empties accounts on short expiries.
ADX Measures Strength, Not Direction
The ADX line is direction-blind. It reports only how forcefully the market is pushing, and a hard sell-off lifts it exactly as a hard rally does. Reading a climbing ADX as a reason to buy misreads the tool. Direction lives in the two companion lines — +DI and −DI — and in which is on top.
Why the Two Belong Together: Fade or Trap
Here is the pairing’s logic. The CCI tells you price is stretched; the ADX tells you whether that stretch is exhaustion or a trend doing its job. Same CCI reading, opposite meaning:
- A fade candidate: CCI beyond ±100 while the ADX is low or rolling over and the DI lines are tangled or converging. Price has travelled far with no committed force behind it — the kind of stretch that tends to relax.
- A trap: the identical CCI extreme, but the ADX is high and still climbing with the DI lines wide apart. Price is far from its average because a real trend is dragging the average behind it. Fading this means trading against the strongest thing on the chart, and the CCI can sit pinned at an extreme for many candles.
The ADX is the gatekeeper; the CCI is what it permits or denies. Neither is a signal alone.
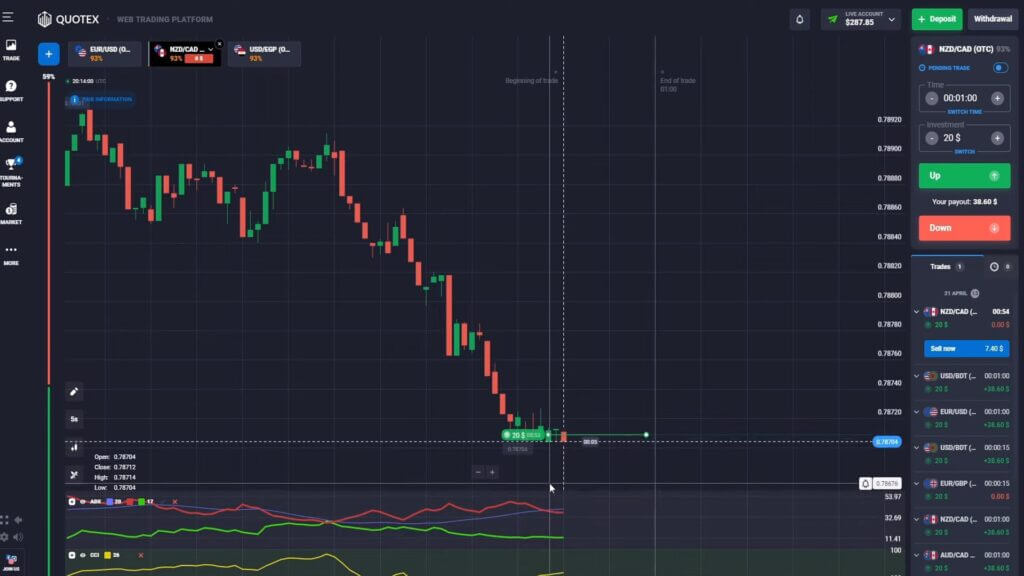
Advance Parameter Settings
The settings this method was built around — conventions, not magic numbers:
- ADX: smoothing 20, DI length 17 — both slower than the standard 14, deliberately: on 5-second candles a 14-period ADX flickers, and the extra smoothing steadies the filter. Display the Plus DI and Minus DI lines (purple and red on the chart above).
- CCI: period 26, with the ±100 levels marked.
- Duration: a 1-minute trade duration read on 5-second candle periods. A 30-second duration is the faster variation, but shorter windows leave less room for a read to work.
Reading the Entry
- Up (call): CCI below −100 and turning back upward, ADX low or fading, DI gap closing. Confirmation is the CCI actually curling, not merely being low — wait for the candle to close.
- Down (put): the mirror image — CCI above +100 and rolling over, with the ADX showing no trend to fight you.
- Stand aside: CCI extreme but ADX high and rising with wide DI separation. That is the trap, and skipping it is where most of the consistency here comes from.
The DI crossover on a rising ADX is a legitimate trend entry, but it is the opposite trade to the CCI fade above — pick one and follow it.
When It Fails, and Risk
It fails when a trend is genuinely strong and the ADX filter is ignored, and around news, where the deviation the CCI divides by has not caught up to volatility. It also fails randomly: one minute is short enough that noise can decide the outcome when the read was sound. Risk a small fixed fraction per trade and keep it fixed — never raise your stake to win a loss back, because each trade is independent and doubling down only concentrates the account into fewer, larger outcomes. Cap trades per session, set a daily loss limit, practise on demo first.
FAQ
Is the “Quotex hack” really a hack?
No. It is a nickname for an indicator combination, nothing more. There is no exploit here and no setup that wins every trade — the ADX simply filters out CCI readings that are unsafe to fade.
Does a CCI above +100 mean sell?
Not on its own. It means price is unusually far above its recent average, which happens both at exhaustion and mid-trend. Check the ADX and DI lines before deciding which you are looking at.
Can I use this on other platforms?
Yes. Both are standard on MetaTrader and most trading platforms, so the logic carries over — only the expiry mechanics change. Related reading: ADX reversals on a 40-second expiry, the Fractal Chaos and ADX pairing, and CCI with Super Trend. Every indicator on the site is included with a single $39 lifetime plan.
This content is for educational purposes only. Trading involves risk. Past results do not guarantee future outcomes. Always practice responsible money management and limit your daily trades to avoid large losses.


