This walkthrough covers a Quotex trading approach that leans on two TradingView tools: an MRS read (a momentum and relative-strength gauge built from MACD and RSI) and a DIV signal that flags divergence between price and momentum. The key thing to understand up front is how the pieces fit together: TradingView is a charting platform, not a trading platform — you read the indicators on its Supercharts, then place the actual trade on Quotex. A signal describes a condition the market is in right now; it is not a prediction of where price goes next.
Quotex Trading With TradingView
TradingView is a charting platform used by millions of traders to study forex, indices, crypto and commodities. Many Quotex traders keep TradingView open on one screen for analysis and Quotex on another for execution: you watch the pair on TradingView, wait for your setup to line up, then switch to the matching pair and expiry on Quotex.
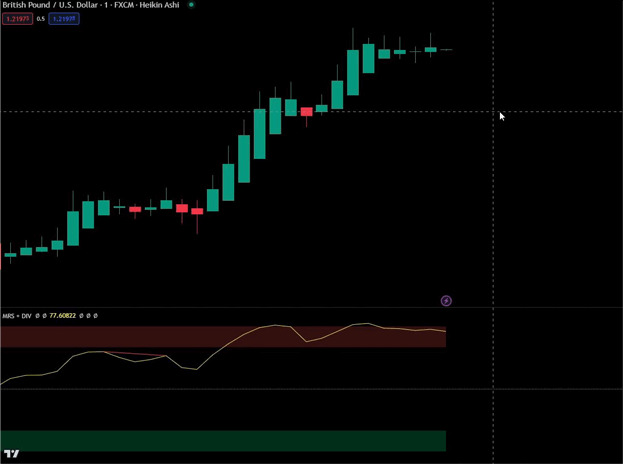
In the example above, GBPUSD is stretched to an extreme on the momentum panel (the red zone), which suggests the current push may be running out of room — a condition to watch, not a command to trade.
What MRS and DIV Plot
The MRS indicator combines MACD and RSI into a single momentum-and-relative-strength read. It colours a panel to show when a pair is stretched to an overbought or oversold extreme, hinting that momentum is fading. The DIV component looks for divergence: when price prints a new high or low but momentum does not follow, it marks a possible loss of conviction behind the move.
Divergence is useful, but it comes with a well-known catch: it often fires early. Momentum can weaken while a trend keeps grinding in the same direction for several more candles, so a divergence flag on its own is not a reversal. Treat MRS and DIV as a two-part filter and only act when the wider chart backs them up.
Adding the Indicators on TradingView
On a TradingView Supercharts layout, open the Indicators dialog at the top of the chart, search for the MRS and DIV scripts by name, and click to add each one. They stack under the price chart so you can watch price and momentum together. To compare several currencies at once you can open multiple tabs or a multi-chart layout — some of those sit behind TradingView's premium tiers, but a single chart is enough to run this method.
Recommended Setup and Settings
- Keep the MRS momentum inputs on their standard MACD and RSI values (MACD 12/26/9, RSI 14) so the panel reacts at a sensible speed rather than flipping on every candle.
- Leave the DIV divergence lookback on its default so it only marks clear divergences instead of small wiggles.
- Trade a handful of liquid pairs you know well rather than jumping across the whole watchlist.
- Let each candle fully close before you read a signal, and keep the chart clean so the MRS extreme and the DIV mark are easy to see.
- Match your Quotex expiry to the timeframe you are reading — a one-minute chart pairs with a short expiry; a five-minute chart with a longer one.
Entry Rules
Wait for both tools to agree, then confirm on price before switching to Quotex:
- Higher (buy / call): MRS shows the pair at an oversold extreme, DIV marks bullish divergence (price makes a lower low while momentum makes a higher low), and price then starts to hold or turn up off that low.
- Lower (sell / put): MRS shows an overbought extreme, DIV marks bearish divergence (price makes a higher high while momentum makes a lower high), and price stalls or rolls over under resistance.
- Stand aside: only one tool is signalling, the two disagree, or price is trending strongly with no confirmation.
When This Setup Fails
Divergence-based reads struggle most in strong, one-directional trends. Price can stay overbought or oversold far longer than feels reasonable, and MRS will sit pinned at an extreme while DIV flags divergence after divergence — each one failing as the trend continues. That is why the confirmation step matters: wait for price to actually react, and skip the setup when the market is clearly running.
Managing Risk
No indicator removes losing trades, so risk control is what keeps you in the game. Stake a small, fixed fraction of your balance on each position, cap how many trades you take in a session, and stop once you hit a preset daily loss limit. Practising on a Quotex demo account until the reads feel automatic is far more valuable than chasing a fast result — the aim of combining MRS and DIV is consistency in your decisions, not a shortcut around risk.
FAQ
Do I trade directly on TradingView?
No. TradingView is where you read the MRS and DIV indicators and study the chart. Once your setup lines up, you place the actual trade on Quotex using the matching currency pair and expiry.
Are the MRS and DIV signals a prediction?
No. They describe a condition — momentum stretched to an extreme, and divergence between price and momentum. Divergence in particular often fires early and can fail if the trend keeps going, so always confirm on price before acting.
Where do I get the indicators and other strategies?
You can explore related walkthroughs like the Quotex easy strategy, the Quotex 1 minute strategy and the Donchian Channel and Schaff Trend Cycle setup. Every indicator and tool on the site is included in one $39 lifetime plan.
This content is for educational purposes only. Trading involves risk. Past results do not guarantee future outcomes. Always practice responsible money management and limit your daily trades to avoid large losses.


