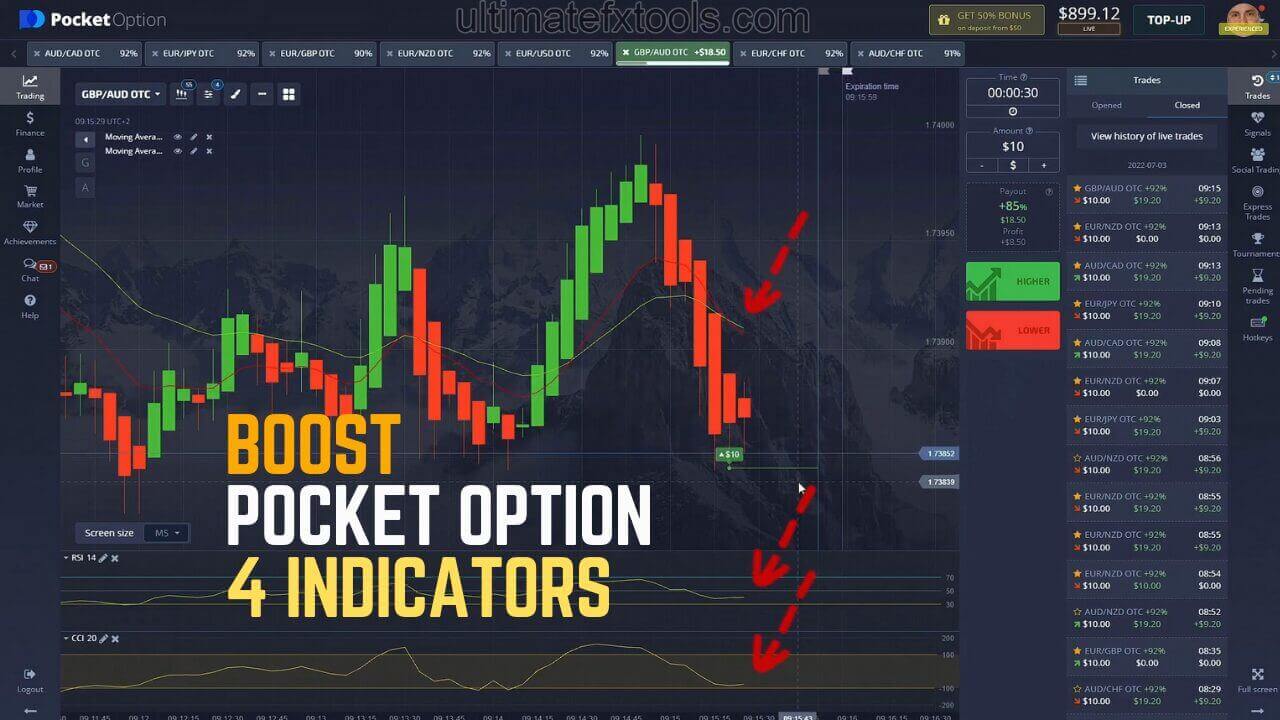
RSI, CCI and EMA: What This Pocket Option Setup Actually Measures
This is a short-expiry Pocket Option method built on three tools read together: the Relative Strength Index (RSI), the Commodity Channel Index (CCI), and two exponential moving averages (EMA). The idea sounds reassuring: three indicators pointing the same way must mean a stronger signal. Before you trust that, it pays to know what each one measures, because two of the three look at almost the same thing.
Two Oscillators Are Not Two Confirmations
Here is the honest core of this setup. RSI and CCI are both momentum oscillators. RSI measures the size of recent up moves against recent down moves and scales the result from 0 to 100. CCI measures how far price has strayed from its own recent average, expressed as a band that usually swings between roughly −100 and +100. Different formulas, but they are driven by the same underlying force: the speed and direction of recent price change. That is why, most of the time, they agree. When RSI pushes toward overbought, CCI is usually pushing above +100 as well, not because two independent witnesses reached the same verdict, but because they are reading the same tape.
So stacking RSI on top of CCI does not give you independent confirmation. It gives you the same opinion twice, which can feel more convincing than it should. If you want a genuinely different input, that is what the EMAs are for: price relative to a moving average, and one EMA relative to another, describes trend direction rather than momentum. Trend and momentum can disagree, and that disagreement carries useful information. Treat the EMAs as the confirmation and the two oscillators as a single momentum reading, not two.
What Each Indicator Plots
- RSI (14): a 0–100 line in its own sub-window. Above 70 is often called overbought, below 30 oversold. On short expiries these are stretch zones, not automatic reversal signals.
- CCI (20): an unbounded oscillator that mostly sits between −100 and +100. Moves beyond those levels flag price stretching from its recent average — useful, but closely related to what RSI already tells you.
- Two EMAs (12 and 23): plotted directly on the price chart. The faster 12 reacts sooner than the slower 23; their slope and crossings read out trend direction, the input the oscillators cannot supply.
Recommended Settings
- RSI Period: 14, with 30 and 70 marked
- CCI Period: 20, with ±100 marked
- EMA: 12 and 23, applied to close
Keep the chart clean and read the EMAs first. For a version that pairs RSI directly with moving averages, the Pocket Option 3 EMA lines with RSI guide covers a similar trend-plus-momentum stack.
Entry Rules on Pocket Option
Let the EMAs set direction, then use the oscillators only to time a stretched moment inside that direction:
- Higher / Buy: the 12 EMA is above the 23 EMA and both are sloping up, and RSI is turning up from near 30 (with CCI lifting from below −100). You are buying a momentum dip inside an up-trend, not a bottom guess.
- Lower / Sell: the 12 EMA is below the 23 EMA and both slope down, and RSI is rolling over from near 70 (with CCI dropping back under +100).
- Stand aside: the EMAs are flat and tangled, or the oscillators are extreme while the trend points the other way. Extreme oscillators in a flat market are where this setup produces its worst signals.
When This Strategy Fails
Two failure modes are worth naming. The first is the ranging market: flat, choppy conditions send RSI and CCI to their extremes over and over while price goes nowhere, and the crossing EMAs whipsaw. Every "signal" looks valid and almost none lead anywhere. The second is false confirmation — because RSI and CCI move together, it is easy to read their agreement as strength, when you have really leaned on one momentum reading dressed up as two. The fix for both is the same: let the EMAs decide whether there is a trend worth trading at all, and stake a small, fixed amount per trade so no single misread does real damage. For a CCI-focused variation that adds a trend filter, see the CCI and Super Trend strategy, and for the moving-average side on its own, the EMA crossover guide.
FAQ
If RSI and CCI both agree, is the signal twice as reliable?
No. RSI and CCI are both momentum oscillators reading the same recent price action, so they usually agree by design. Their agreement is close to one signal, not two independent ones. The genuinely separate input in this setup is trend direction from the EMAs.
What are the best settings to start with?
RSI at 14 with 30/70 levels, CCI at 20 with ±100 levels, and EMAs of 12 and 23 on the price chart. These are common defaults; adjust only after watching how they behave on the pairs and expiry you actually trade.
Do I need to buy anything to use this?
No — RSI, CCI and EMA are standard indicators available on Pocket Option and in MetaTrader. If you later want the full library of custom indicators and strategies, they are bundled in a single $39 lifetime plan.
This content is for educational purposes only. Trading involves risk. Past results do not guarantee future outcomes. Always practice responsible money management and limit your daily trades to avoid large losses.