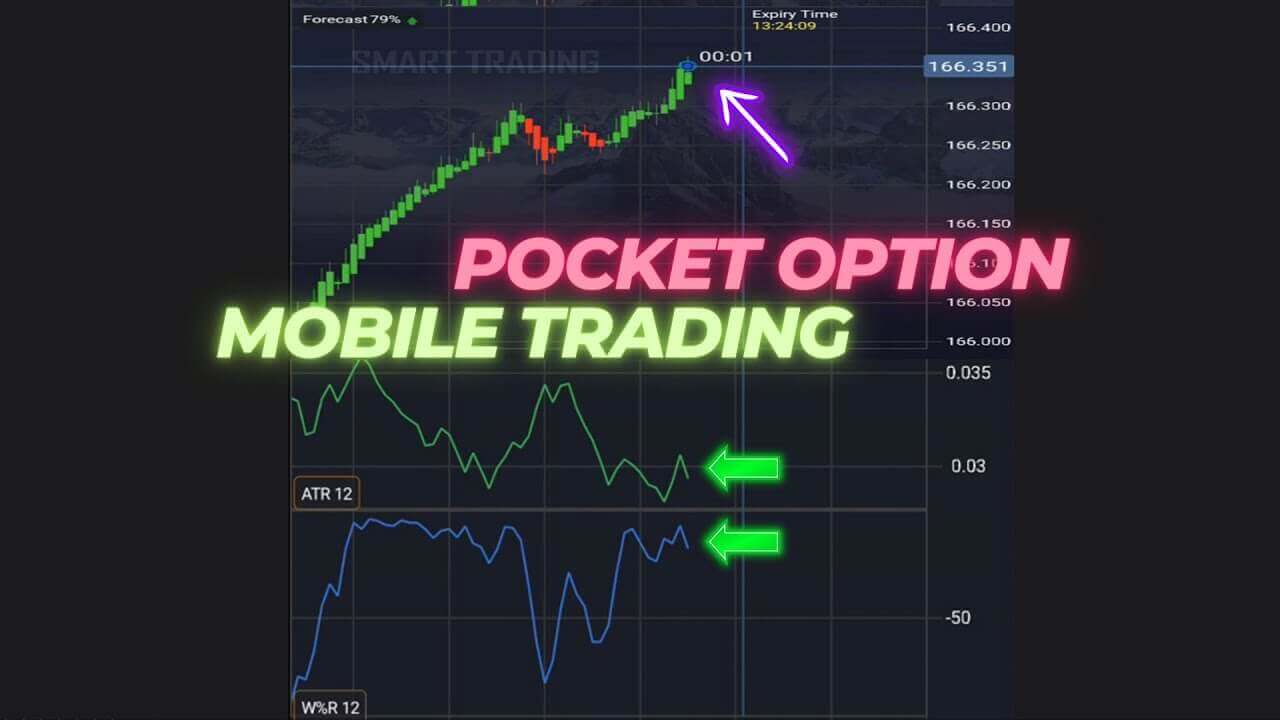
ATR and Williams %R on Pocket Option Mobile
This is a short-expiry reversal idea for Pocket Option that pairs two very different tools: the Average True Range (ATR) and the Williams Percentage Range (Williams %R). They work together because they answer separate questions: ATR tells you how much price is moving, and Williams %R tells you where the current price sits inside its recent range. One gauges volatility; the other times the pullback. Neither predicts the future — they organise what price is already doing so you can make a calmer decision inside a one-minute window.
What each indicator actually measures
ATR measures volatility, not direction. It averages the true range of recent candles into a number that rises when the market moves quickly and falls when it goes quiet. A rising ATR says a move has real energy behind it; a flat, low ATR warns that price is drifting and reversals are likely to fizzle. ATR never tells you whether to buy or sell — it tells you whether a signal is worth acting on at all.
Williams %R is a momentum oscillator that swings between -100 and 0. Readings near 0 (above -20) mark an overbought stretch where price is near the top of its recent range; readings near -100 (below -80) mark an oversold stretch near the bottom. Those extremes are where short-term reversals tend to form. Williams %R is fast and whipsaws in quiet markets, which is why the ATR reading beside it matters: it filters out the flat conditions where the oscillator gives its worst signals.
A note on Pocket Option mobile
Custom indicators do not run inside the Pocket Option mobile app. On a phone you are limited to the platform's own built-in ATR and Williams %R from the indicators menu, or you read both tools in MetaTrader on desktop and time your entry against the matching Pocket Option candle. The app is fine for placing the trade, but the analysis is cleaner on a larger chart.
Recommended settings
- ATR period: 12. This is responsive enough for one-minute reading without reacting to every single candle.
- Williams %R period: 12, with the overbought level at -20 and the oversold level at -80. If the pair you trade whipsaws, widen the levels toward -10 and -90 so only deeper extremes trigger.
- Timeframe / expiry: the one-minute chart with a one-minute expiry suits the reversal style. In choppy conditions, step up to a two-minute reading.
- Trade a small number of liquid pairs you know well and let each candle fully close before you read the setup.
Entry logic
The idea is to fade an exhausted move, but only when volatility confirms the move was real:
- Call (up): Williams %R is in oversold territory (below -80) and starting to curl back up, price is at the bottom of its recent range, and ATR is elevated rather than flat — showing the sell-off had genuine momentum that can now snap back.
- Put (down): Williams %R is in overbought territory (above -20) and starting to roll over, price is at the top of its range, and ATR confirms the push up had real energy.
- Stand aside: ATR is flat and low, or Williams %R is hovering in the middle of its range with no extreme. A middle reading is not a signal.
When it fails
The biggest weakness of any oscillator reversal is a strong trend. In a powerful move, Williams %R can sit pinned in overbought or oversold territory while every "reversal" signal gets run over. That is why ATR is in the mix — but ATR is blunt, and a high reading during a trend looks identical to a high reading before a reversal. Treat a single overbought or oversold print as a reason to watch, not a reason to fire. Waiting for the oscillator to actually turn back from the extreme, rather than entering the moment it arrives, is the difference between fading a reversal and standing in front of a trend.
FAQ
Can I run this ATR and Williams %R setup on the Pocket Option mobile app?
Only with the platform's built-in indicators. Custom indicator files do not load in the mobile app, so add ATR and Williams %R from the app's own indicators menu, or read both in MetaTrader on desktop and place the trade on your phone.
Why combine two indicators instead of using one?
Because they measure different things. Williams %R times the pullback by flagging overbought and oversold extremes, while ATR checks whether the market is moving enough for that reversal to matter. Using only the oscillator leaves you exposed to flat, choppy conditions where it reads worst.
Is this strategy included with the tools?
The core ATR and Williams %R indicators are standard on most platforms, so you can build this for free. The full indicator library, including the alert-based tools, is bundled in the single $39 lifetime plan.
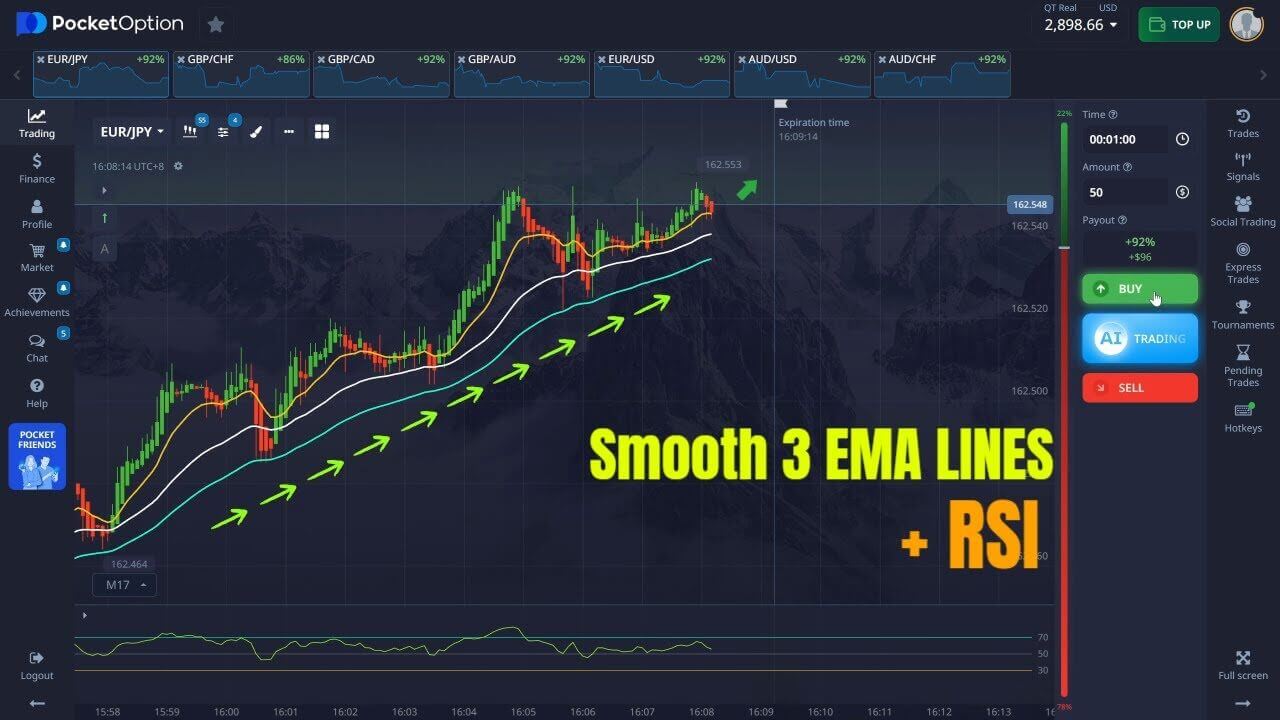
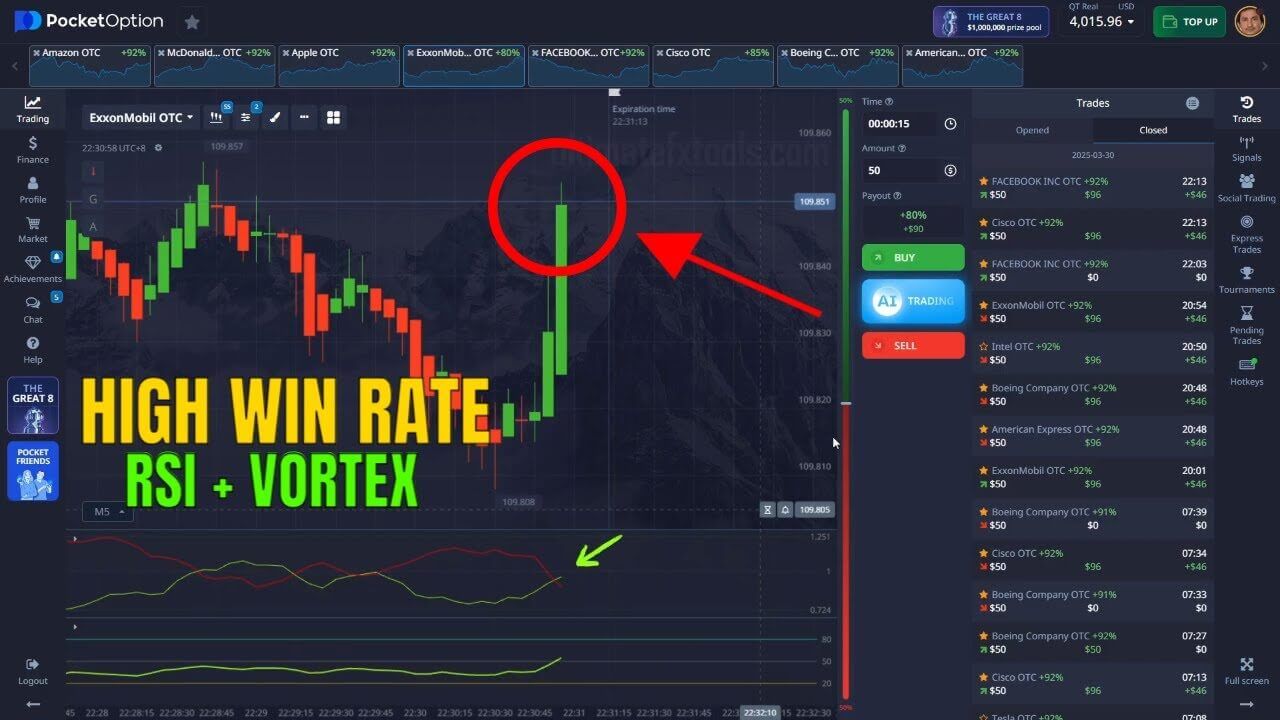
For more Pocket Option setups that pair a momentum tool with a filter, see 3 EMA lines with RSI, the Vortex and RSI strategy, and the Super Trend strategy. Always test the rules on a demo account until the reads feel automatic, and manage risk on every trade.
This content is for educational purposes only. Trading involves risk. Past results do not guarantee future outcomes. Always practice responsible money management and limit your daily trades to avoid large losses.