Pocket Option Vortex and RSI Crossing Strategy
The Vortex Crossing approach pairs two well-known technical tools to read short-term momentum on Pocket Option. The Vortex Indicator (VI) is designed to flag the start of a possible new trend, while the Relative Strength Index (RSI) measures whether price has stretched into overbought or oversold territory. Used together, one tool suggests direction and the other helps time the entry. Read this first: a crossover marks a possible shift in momentum, it does not predict the future. Every signal still needs context and disciplined risk control.
What the Vortex Indicator Actually Shows
The Vortex Indicator plots two lines that move against each other:
- VI+ tracks upward (bullish) price movement.
- VI- tracks downward (bearish) price movement.
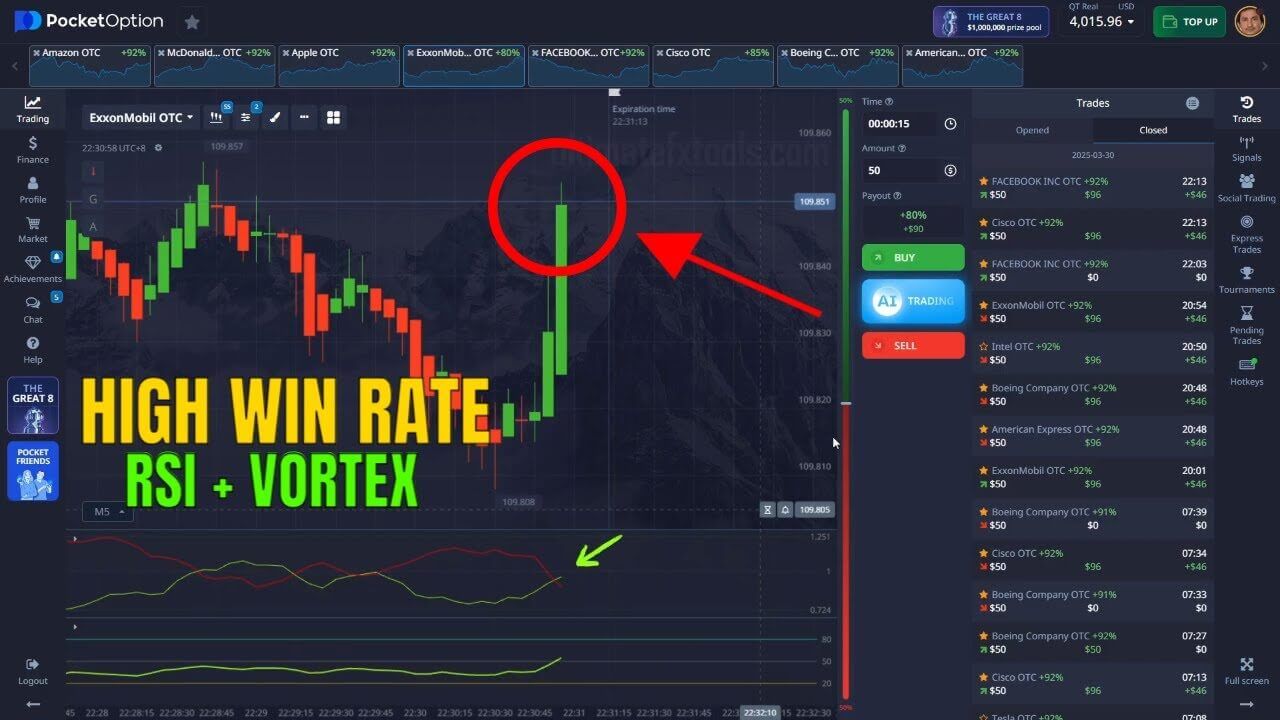
When VI+ rises above VI-, buyers are gaining the upper hand and the reading leans bullish. When VI- rises above VI+, sellers are in control and the reading leans bearish. The point where the two lines cross is the "Vortex Crossing." It marks the moment momentum may be changing hands, but a cross on its own can also appear in choppy, directionless price action, which is exactly where false signals come from. That is why the RSI filter matters.
Why Add RSI as a Filter
RSI moves between 0 and 100 and helps you avoid taking a crossover at a poor location. If VI+ crosses above VI- while RSI is turning up from an oversold zone, the two tools agree and the setup is cleaner. If a bullish cross appears while RSI is already deep in overbought territory, the move may be late and the signal is better skipped. Filtering out those conflicting crosses, rather than taking every one, is the single biggest factor in trading with more consistency instead of chasing every line cross.
Indicator Setup and Settings
Load both indicators in MetaTrader (or your charting tool of choice) and read them against the matching Pocket Option chart. These are the settings this guide is built around:
| Indicator | Settings | Purpose |
|---|---|---|
| Vortex (VI) | Period = 18 | Marks possible momentum shifts |
| RSI | Period = 24, Levels = 20 / 50 / 80 | Filters overbought and oversold zones |
| Timeframe | 5-second candles | Suited to 15-30 second trades |
Entry Rules
- Buy / Up: VI+ crosses above VI-, RSI is rising and holding above the 50 midline (ideally turning up from near the 20 level), and price is not stuck in a flat range.
- Sell / Down: VI- crosses above VI+, RSI is falling and sitting below the 50 midline (ideally turning down from near the 80 level).
- Stand aside: the cross and RSI disagree, or price is ranging tightly with no momentum. A cross with no RSI agreement is treated as noise and skipped.
When This Strategy Fails
No indicator combination removes losing trades. The Vortex Crossing struggles most during strong one-way trends, where VI+ and VI- can whip across each other repeatedly; during low-liquidity or news-driven spikes, where both indicators lag the price; and inside very tight ranges, where crossovers fire constantly with no follow-through. On the ultra-fast 5-second timeframe these problems are amplified, because a single erratic candle can trigger a cross. Treat short-expiry trading as high-risk and size every position with that in mind.
Risk Management First
An earlier version of this guide suggested a martingale approach, doubling your stake after a loss. We do not recommend it. Doubling down chases losses and can drain an account in a short losing streak, which is common on fast expiries. Instead, stake a small, fixed fraction of your balance on each trade, cap how many trades you take per session, and stop for the day once you hit a preset loss limit. The aim is steady, repeatable decisions rather than one big result. Practice the rules on a demo account for at least 50 trades until the reads feel automatic before risking real funds.
Want to see the same idea with a different filter? Compare it with the Vortex + CCI 10-second Pocket Option strategy, or explore how RSI works alongside moving averages in the 3 EMA lines with RSI guide. Before going live, read the Pocket Option risk trading guide to set your limits. Every indicator on the site is included with a single $39 lifetime plan.
FAQ
Does a Vortex crossover predict a reversal?
No. A crossover marks a possible shift in momentum as VI+ and VI- change places; it does not predict what price will do next. Treat it as a prompt to check RSI and the surrounding price context, not as a forecast.
What timeframe and expiry does this use?
The configuration here uses 5-second candles with 15-30 second expiries, which is very fast and high-risk. Slower candles and longer expiries generally produce fewer false crosses and are easier to read, so many traders adapt the same rules to a calmer setup.
Do I need to buy anything to try this?
The Vortex Indicator and RSI are standard tools available on most charting platforms, so you can test the method for free on a demo account. The premium alert indicators and full library are optional and covered by the single $39 lifetime plan.
This content is for educational purposes only. Trading involves risk. Past results do not guarantee future outcomes. Always practice responsible money management and limit your daily trades to avoid large losses.