Pocket Option 3 EMA Trading Strategy
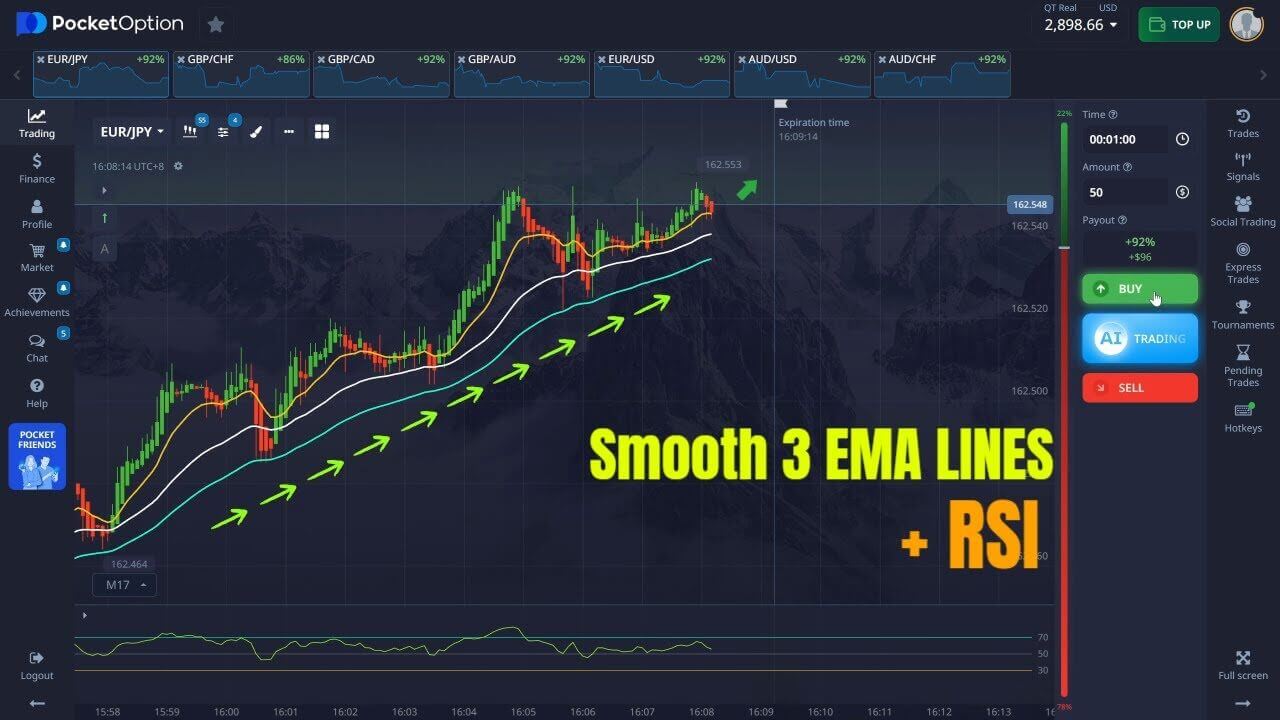
The 3 EMA lines with RSI method is a trend-following setup for trading currency pairs on Pocket Option. The idea is simple: use three exponential moving averages to read the direction and strength of a move, then use the Relative Strength Index (RSI) as a second, independent check before you commit. Neither part is a signal on its own, but together they give a clearer picture of when a trend is actually in control of price.
One thing worth being honest about up front: all three EMAs are the same type of indicator, just with different lookback periods. Because they are drawn from the same price data, they are heavily correlated and tend to agree. That is why RSI matters here — it measures momentum differently, so it can flag when price is stretched or losing steam even while the moving averages still look aligned.
The Three EMAs and RSI Explained
A common configuration uses a fast, a medium, and a slow EMA so you can see short-term and longer-term momentum on the same chart:
- Fast EMA (around 12): reacts quickly to recent candles and shows short-term momentum.
- Medium EMA (around 35): smooths out the noise and helps confirm the working direction.
- Slow EMA (around 60): represents the broader trend the other two are moving within.
For RSI, a period of 14 is standard, with 70 and 30 marking the overbought and oversold zones and the 50 line acting as a rough momentum midpoint. You can smooth RSI with a slightly longer period if you find the default too jumpy on fast timeframes.
How the Two Read Signals Together
The EMAs and RSI are not measuring the same thing, and that is the point. The moving averages describe direction and how the time horizons are stacked. RSI describes momentum — whether buyers or sellers are doing the heavier work. When both agree, you have two separate reasons to consider a trade. When they disagree — EMAs pointing up while RSI rolls over from the overbought zone — that conflict is itself useful and often a reason to stand aside.
Timeframe and Entry Rules
Shorter timeframes carry more noise, so many traders prefer the 5-minute chart over the 1-minute for cleaner reads. Major pairs such as EUR/USD or GBP/USD tend to behave more predictably than thin, volatile symbols. A basic framework:
- Trend check: the EMAs are stacked in order — fast above medium above slow for longs, and the reverse for shorts.
- Entry check: price pulls back to or crosses the fast EMA, and RSI confirms by holding above 50 for a long or below 50 for a short.
- Stand aside: when the three EMAs are tangled and crossing each other, the market is ranging and this method struggles.
That last point deserves emphasis. Moving averages whipsaw badly in choppy, sideways conditions, producing repeated false crosses. RSI helps a little, but no filter fully removes the problem. If the chart is going nowhere, the strategy has no edge to offer.
Realistic Expectations
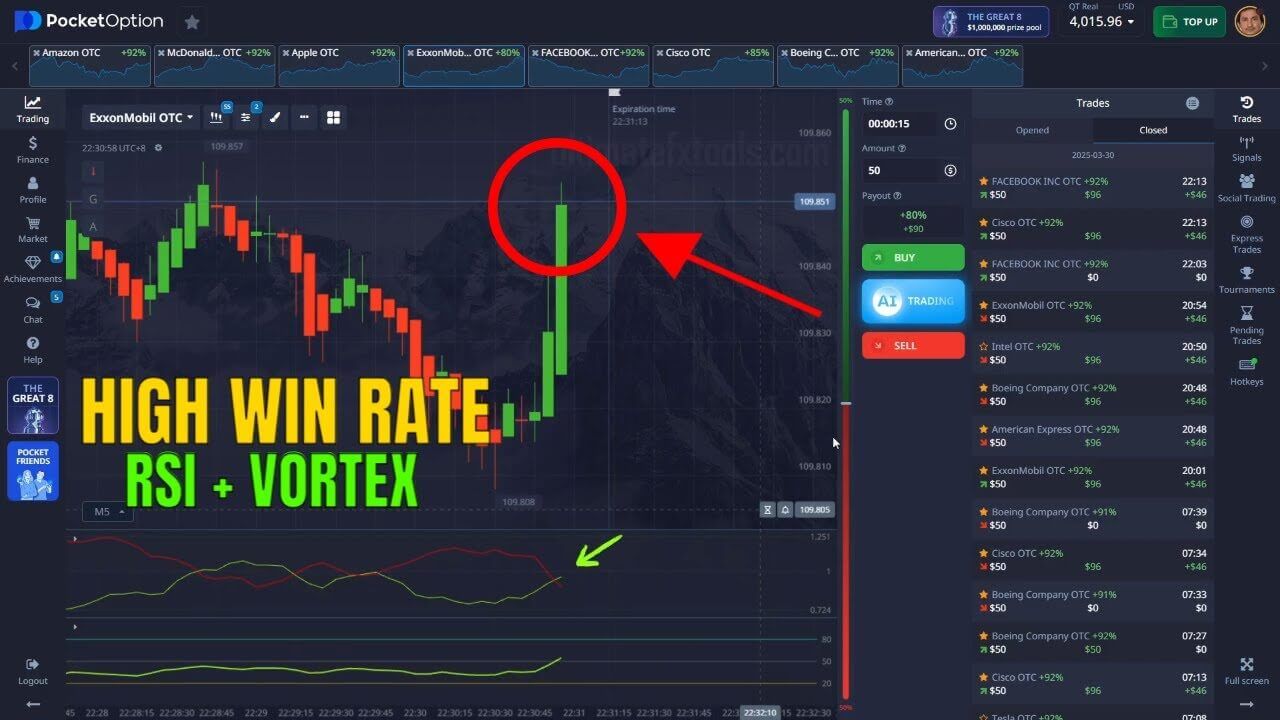
This is a directional-bias tool, not a crystal ball. It works best when a genuine trend is present and gives back ground when the market ranges. Treat it as one input, test it on a demo account until the rules feel natural, and keep records of how it behaves on the pairs you trade. For a similar structure to compare against, the Vortex & RSI strategy and the breakout strategy approach the same market from different angles.
Risk Management
Risk control is what keeps you in the game long enough for any method to matter:
- Keep each position small — a fixed, modest percentage of your account rather than a size that a single loss could dent badly.
- Avoid trading straight into major news releases, when spreads and volatility spike unpredictably.
- Do not chase losses by increasing size. Martingale-style stake doubling is dangerous — a short losing streak can wipe an account, so treat it as something to avoid, not a system.
- Set a daily stop and walk away when you hit it, win or lose.
If you would rather not configure indicators by hand, our full library of ready-made MT4/MT5 indicators and strategies is available with a single $39 lifetime purchase.
Frequently Asked Questions
Does the 3 EMA and RSI strategy win every trade?
No. No strategy wins every trade, and this one is no exception. It aims to put the odds slightly in your favor when a trend is present, but it produces losing trades — especially in ranging markets — and results vary by pair and conditions.
Why use RSI if I already have three EMAs?
Because the three EMAs are the same type of indicator and largely agree with one another, they can all be wrong together in a chop. RSI measures momentum independently, so it adds a genuinely different perspective and can flag exhaustion the moving averages miss.
What timeframe works best?
There is no single best answer. Many traders find the 5-minute chart a reasonable balance between signal frequency and noise on Pocket Option. Shorter charts give more signals but more false ones. Test a few on demo and see what suits you.
This content is for educational purposes only and is not financial advice. Trading involves substantial risk; you can lose some or all of your capital. No result is guaranteed and past performance does not indicate future results. Trade only what you can afford to lose.