☆☆☆☆☆ 4.5/5
Ultimate Trend
- ultimatefxtools
- November 4, 2020
- Indicator
- Binary Options
“Ultimate Trend Optimized your Trading Capability”
“Provides Advance Indication of the Market Trends”
“Simple Ichimoku Kinko Hyo”

“Ultimate Trend Optimized your Trading Capability”
“Provides Advance Indication of the Market Trends”
“Simple Ichimoku Kinko Hyo”
The Ultimate Trend Indicator is a powerful MetaTrader 4 (MT4) indicator designed to help traders identify trend strength and potential reversal points in the forex and stock markets. Developed by Ultimatefxtools, this indicator combines multiple technical analysis techniques to generate clear buy and sell signals.
The indicator uses a combination of Ichimoku, Exponential Moving Averages (EMA), Linear Weighted Moving Averages (LWMA), and overbought/oversold (OB/OS) detection to determine trend strength. Here’s a breakdown of its core components:
1. Price Smoothing with EMA
The indicator applies an EMA (Exponential Moving Average) to smooth price data.
The default EMA period is 32, but traders can adjust this setting.
The EMA helps filter out market noise and highlights the underlying trend.
2. Overbought/Oversold Detection
The indicator calculates deviations from the EMA to detect overbought and oversold conditions.
A 25-period OB/OS detection helps identify potential reversal zones.
3. Trend Strength Measurement
The LWMA (Linear Weighted Moving Average) is applied to the OB/OS values to measure trend momentum.
The default LWMA period is 6, providing a responsive trend strength reading.
4. Dynamic Trend Levels
The indicator plots two dynamic levels:
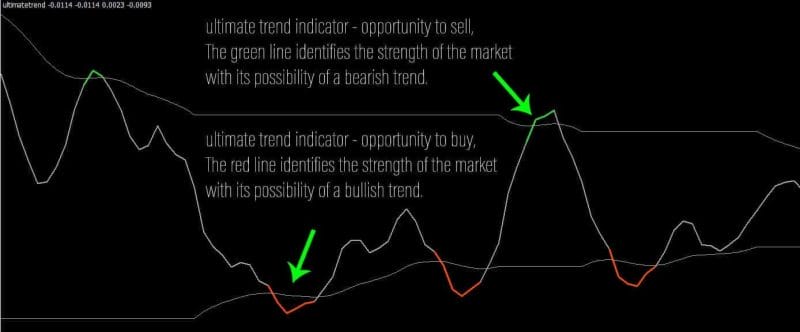
Upper Level (Bullish Trend) – When price breaks above this level, it signals strong bullish momentum.
Lower Level (Bearish Trend) – When price breaks below this level, it signals strong bearish momentum.

✅ Multi-Timeframe Analysis – Works on any timeframe.
✅ Customizable Parameters – Adjust EMA, LWMA, and OB/OS periods.
✅ Visual Alerts – Color-coded signals for easy trend identification.
✅ Alert Notifications – Optional alerts via pop-up, email, or sound.
The indicator provides three main signals:
1. Bullish Trend Signal (Green Line)
When the trend line turns green and breaks above the upper level, it indicates a strong uptrend.
Traders may consider buying or holding long positions.
2. Bearish Trend Signal (Red Line)
When the trend line turns red and breaks below the lower level, it signals a strong downtrend.
Traders may consider selling or holding short positions.
3. Neutral/Gray Zone (Consolidation)
If the trend line is gray, the market is in a range-bound or weak trend phase.
Traders should wait for a stronger breakout before entering trades.

Download Ultimate Trend Indicator and Additional Premium Indicators


…