ZigZag Meets AI: What This Setup Is
The ZigZag indicator is one of the oldest tools in the book — it filters out noise and draws clean lines from swing low to swing high, so you can instantly see where the market turned. Its weakness has always been interpretation: it shows you the swings, but it never tells you whether the current leg is about to reverse. That is exactly the gap the PipGems AI Chart Scanner fills in this session.
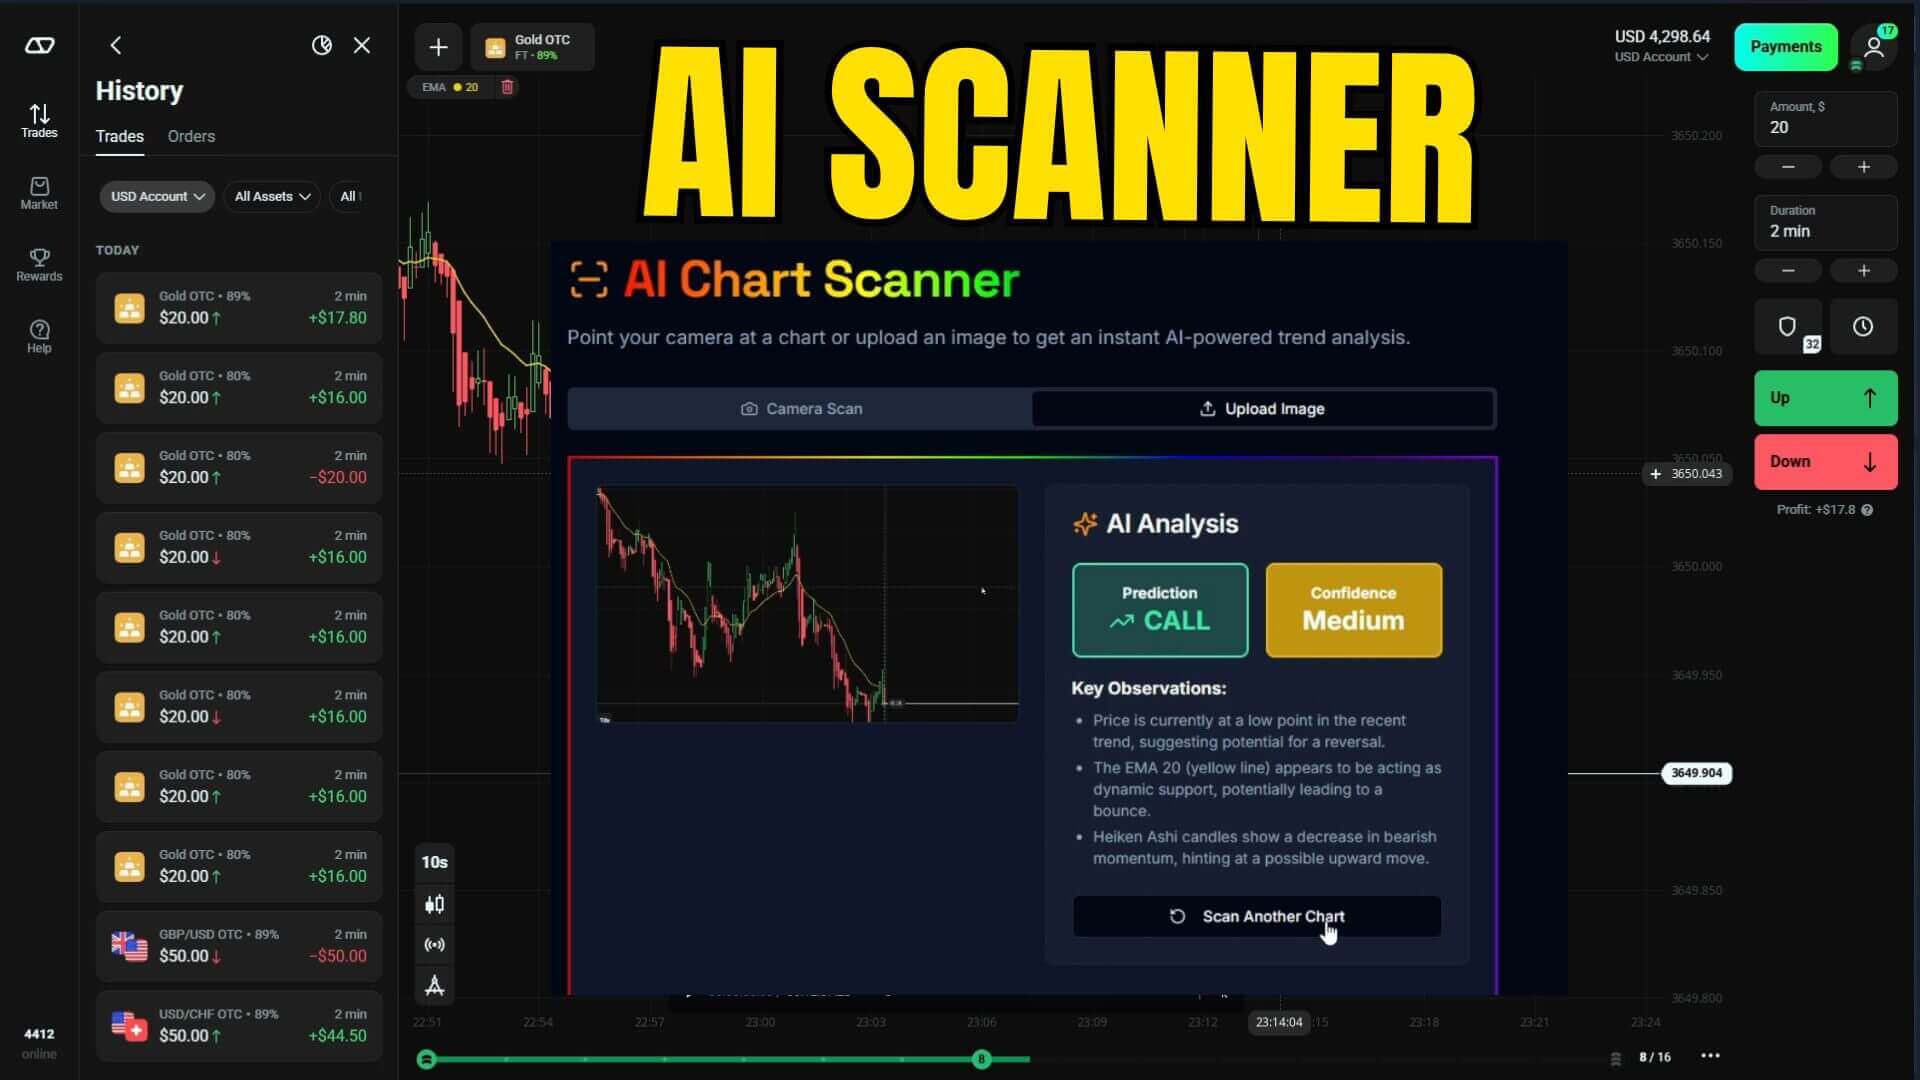
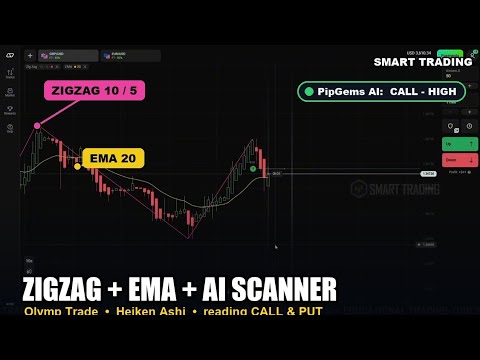
The workflow is simple: run Olymp Trade with ZigZag on the chart, take a screenshot, and feed it to the AI scanner. The AI reads the ZigZag structure plus the Heikin Ashi candles and returns a CALL or PUT prediction, a confidence rating, and a short list of key observations explaining why — then you decide whether to take the 1-minute trade.
Chart Setup on Olymp Trade
- Platform: Olymp Trade (fixed-time trades, demo account in the video)
- Candles: Heikin Ashi, 10-second timeframe
- Indicator: ZigZag with a Depth of 10 and a Deviation of 5%
- Trade duration: 1 minute
- Pairs traded: EUR/USD first, then GBP/USD (with an EMA added for extra trend context)
Configuring the AI Scanner
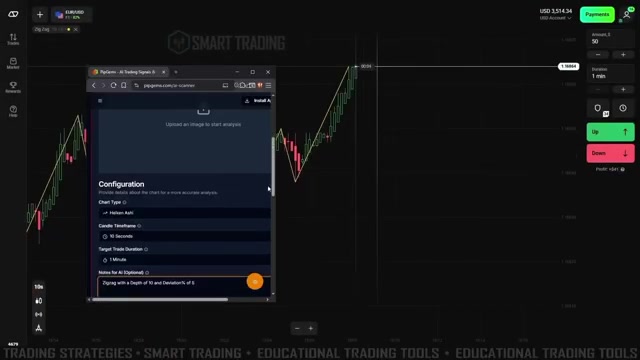
The scanner needs to know what it is looking at, so before the first scan you fill in the configuration panel. This is the exact setup used in the video:
- Chart Type: Heiken Ashi
- Candle Timeframe: 10 seconds
- Target Trade Duration: 1 minute
- Notes for AI: "ZigZag with a Depth of 10 and Deviation% of 5" — telling the AI which indicator is drawn on the chart makes its analysis far more accurate
Reading the CALL & PUT Signals
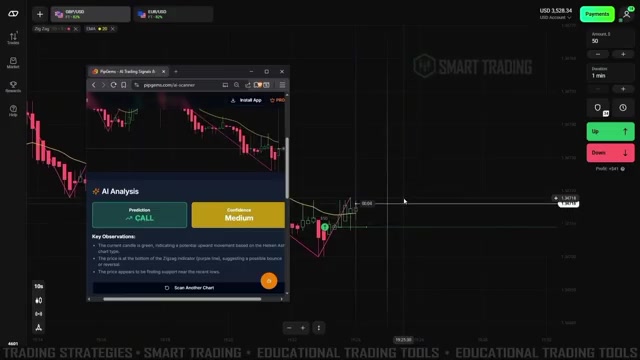
After each scan the AI returns three things: a Prediction (CALL or PUT), a Confidence level, and Key Observations. The observations are the interesting part — the AI actually reasons about the ZigZag structure, for example:
- "The ZigZag indicator suggests the price has reached a peak and is likely to reverse" → PUT
- "The price is at the bottom of the ZigZag indicator, suggesting a possible bounce" plus a green Heikin Ashi candle showing upward pressure → CALL
In this session the signals came back with Medium confidence — which is honest. A 10-second Heikin Ashi chart moves fast, and the AI does not pretend to certainty it doesn't have. That is exactly why you still confirm the last couple of candles before clicking Up or Down.
The Live Session — Wins and Losses
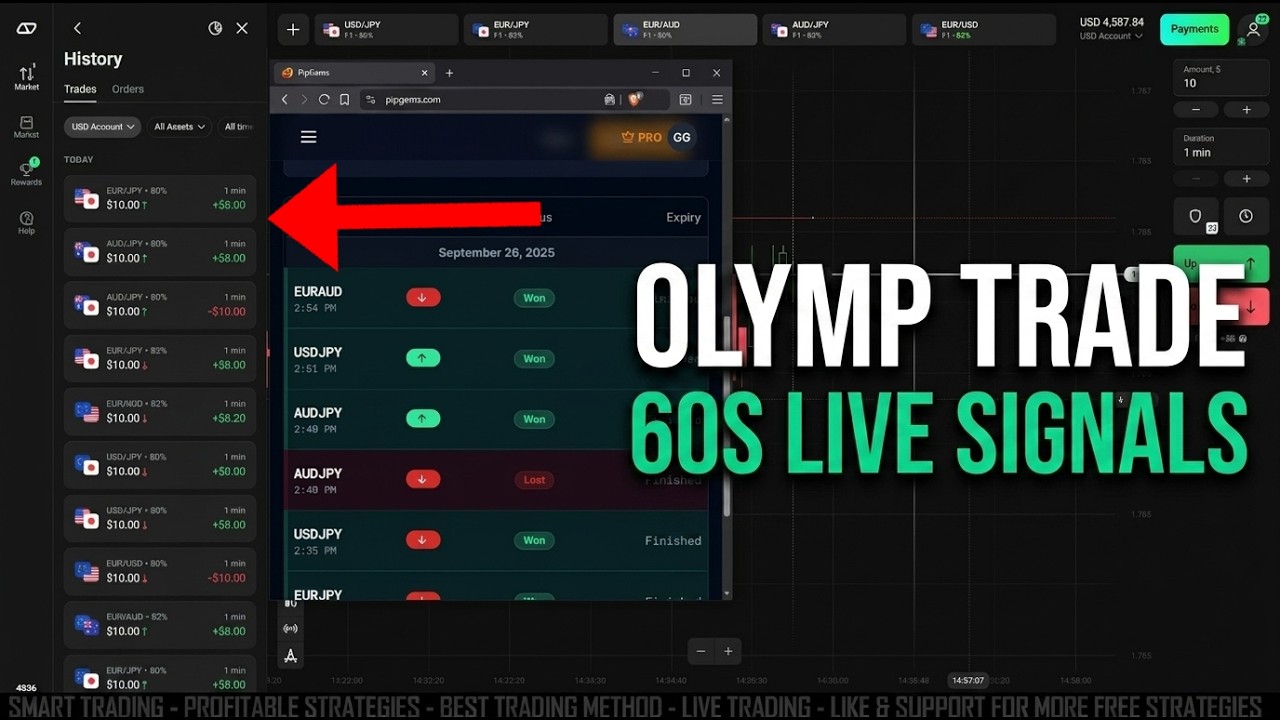
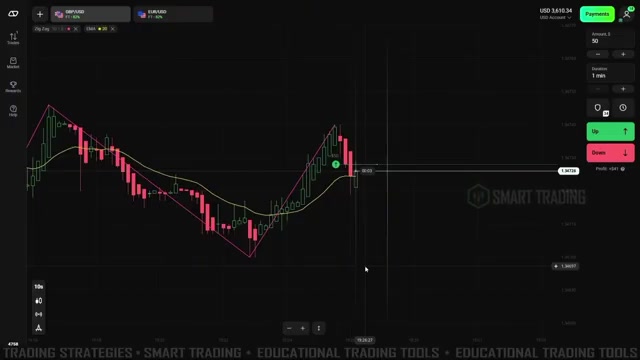
The video runs the setup live on a demo account with fixed $50 stakes. It starts on EUR/USD, where a PUT read at a ZigZag peak plays out cleanly, then switches to GBP/USD with an EMA added on top for trend context. The balance moves from roughly $3,514 to $3,610 across the session — but not in a straight line. There are losing trades in between, shown on screen, which is worth more than any highlight reel: this is what trading medium-confidence signals on a fast chart actually looks like.
Watch the Full Live Session
See the scanner configuration, each CALL/PUT read, and every trade from entry to expiry:
Risk Management Rules
- Treat Medium confidence as what it is — skip the trade if the candles disagree with the prediction.
- Use a fixed stake per trade (the video uses a constant $50 on a ~$3,500 demo balance, about 1.4%).
- Cap your daily number of trades so one choppy session can't spiral.
- Practice the screenshot-scan-confirm routine on a demo account before using real funds.
The Verdict
This setup earns a solid-but-not-spectacular 3.5 out of 5. The AI scanner's reasoning about ZigZag structure is genuinely useful — it explains its predictions instead of just flashing arrows, and the session ends green with losses shown honestly. What holds it back is the pace: scanning a screenshot for every 1-minute trade on a 10-second chart is a manual loop, and Medium-confidence signals mean you still need your own judgment on every entry. Best used as a second opinion on ZigZag reversals rather than a standalone signal machine.
#ZigZag #AIScanner #OlympTrade #PipGems #1MinuteTrading #HeikinAshi #FixedTimeTrades #TradingSignals
This content is for educational purposes only and is not financial advice. All examples shown are on a demo account. Trading involves substantial risk; you can lose some or all of your capital. No result is guaranteed and past performance does not indicate future results. Trade only what you can afford to lose.