IQ Option 15 Seconds Trading
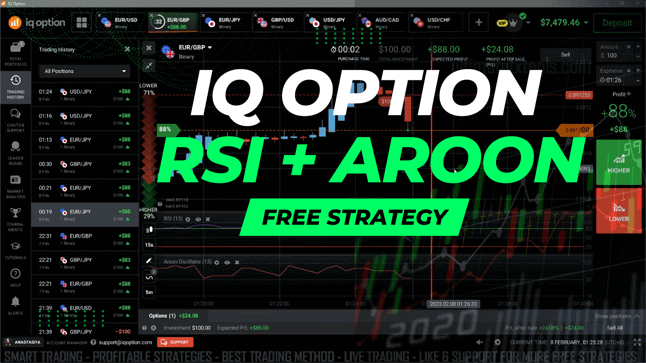
IQ Option lets you set an expiry as short as 15 seconds, and that single choice changes how you read a chart. At that speed you are not analysing a trend — you are reading the next handful of ticks. This guide covers a two-indicator approach pairing the RSI with the Aroon Oscillator, what each measures, and why the 15-second window is the hardest place on the platform to apply them. Treat it as a framework for study, not a shortcut.
What the RSI Actually Measures
The Relative Strength Index compares recent up-closes against recent down-closes on a 0–100 scale. It is a momentum gauge, not a direction gauge. Above 70 says buyers have been dominant recently; below 30, sellers. Those zones get labelled overbought and oversold, but the label misleads beginners: an RSI at 75 does not mean price must fall — in a strong move it can sit pinned there while price runs. What it gives you is context on whether the current push is stretched against its own recent history.
What the Aroon Oscillator Adds
The Aroon Oscillator answers a different question: how recently did this market make a new high or low? It tracks the bars since the highest high and the lowest low in the lookback window, then subtracts one from the other. Near +100 means fresh highs are being printed; near -100 the opposite; around zero, neither side has made new ground and the market is drifting sideways.
That is why they complement each other. RSI tells you how hard the market is pushing; Aroon tells you whether that push is producing new territory or just churning. A stretched RSI with Aroon near zero is a market spinning its wheels in a range; a stretched RSI with Aroon strongly positive is a real trend that happens to be extended. RSI alone cannot separate the two. The same logic drives the IQ Option ATR and Aroon setup, which swaps the momentum gauge for a volatility one.
The Setup and Settings
Build the chart before you think about entries:
- Chart candles: 15 seconds, so each bar matches the expiry you intend to trade.
- Expiry: 15 seconds for the core version, or a 1 minute duration when the faster reads feel too erratic.
- RSI: period 14 with the standard 70 / 30 levels. Some traders tighten to 80 / 20 on fast charts.
- Aroon Oscillator: period 14, with the zero line clearly visible.
- Asset: one liquid pair you know, during an active session. Thin markets give the worst 15-second reads.
Entry Rules
Keep them short enough to apply in a few seconds:
- Up / call: RSI has dipped near the oversold zone and is turning back up, and Aroon is above zero or crossing up through it — momentum recovering while the market can still make new highs.
- Down / put: RSI has pushed into the overbought zone and is rolling over, and Aroon is below zero or crossing down through it.
- Stand aside: the two disagree, or Aroon is flat around zero. On a 15-second chart this is the call you will make most often if you are disciplined.
Read the signal on the close of a candle, not mid-formation — a 15-second bar can look bullish for ten seconds and close bearish.
Being Honest About 15 Seconds
Short expiries are noisier and far less forgiving. Both RSI and Aroon are calculated from closed bars, so both lag — and at 15 seconds that lag is a meaningful fraction of your whole trade. Tick noise, spread, and execution delay all weigh more heavily in so small a window, and a signal that reads cleanly on a 1 minute chart may be meaningless at 15 seconds. Most traders find their consistency improves by slowing down, not speeding up: the 30 seconds technique and the 1 minute strategy apply the same logic with more room to breathe, and the Aroon and RSI Quickler setup is a useful comparison.
Risk Management Comes First
Because losing trades are unavoidable, position sizing is what actually protects you. Risk a small fixed percentage of your balance per trade, cap your trades per session, and set a daily loss limit you stop at without negotiating. Never raise stake size to recover a loss. Practise on an IQ Option demo account until you have watched the setup fail repeatedly — that failure is data, and you want to collect it with fake money.
IQ Option 15 Seconds Candle - RSI and Aroon Oscillator
FAQ
Is RSI and Aroon a good combination for beginners?
The pairing is sound because the two measure different things, but the 15-second timeframe is not beginner territory. Learn it on a 1 minute chart first, where signals develop slowly enough to read.
Should I use the 70/30 or 80/20 RSI levels?
On fast charts the RSI touches 70 and 30 constantly, producing a flood of weak signals. Tightening to 80 / 20 gives fewer setups with more conviction behind them. Test both on demo and keep the one you can follow under time pressure.
Do I need a paid indicator for this?
No — RSI and Aroon are both built into IQ Option and MetaTrader at no cost, and this works with the defaults. If you later want alert-based tools that flag these conditions for you, every indicator on the site is covered by a single $39 lifetime plan.
This content is for educational purposes only. Trading involves risk. Past results do not guarantee future outcomes. Always practice responsible money management and limit your daily trades to avoid large losses.