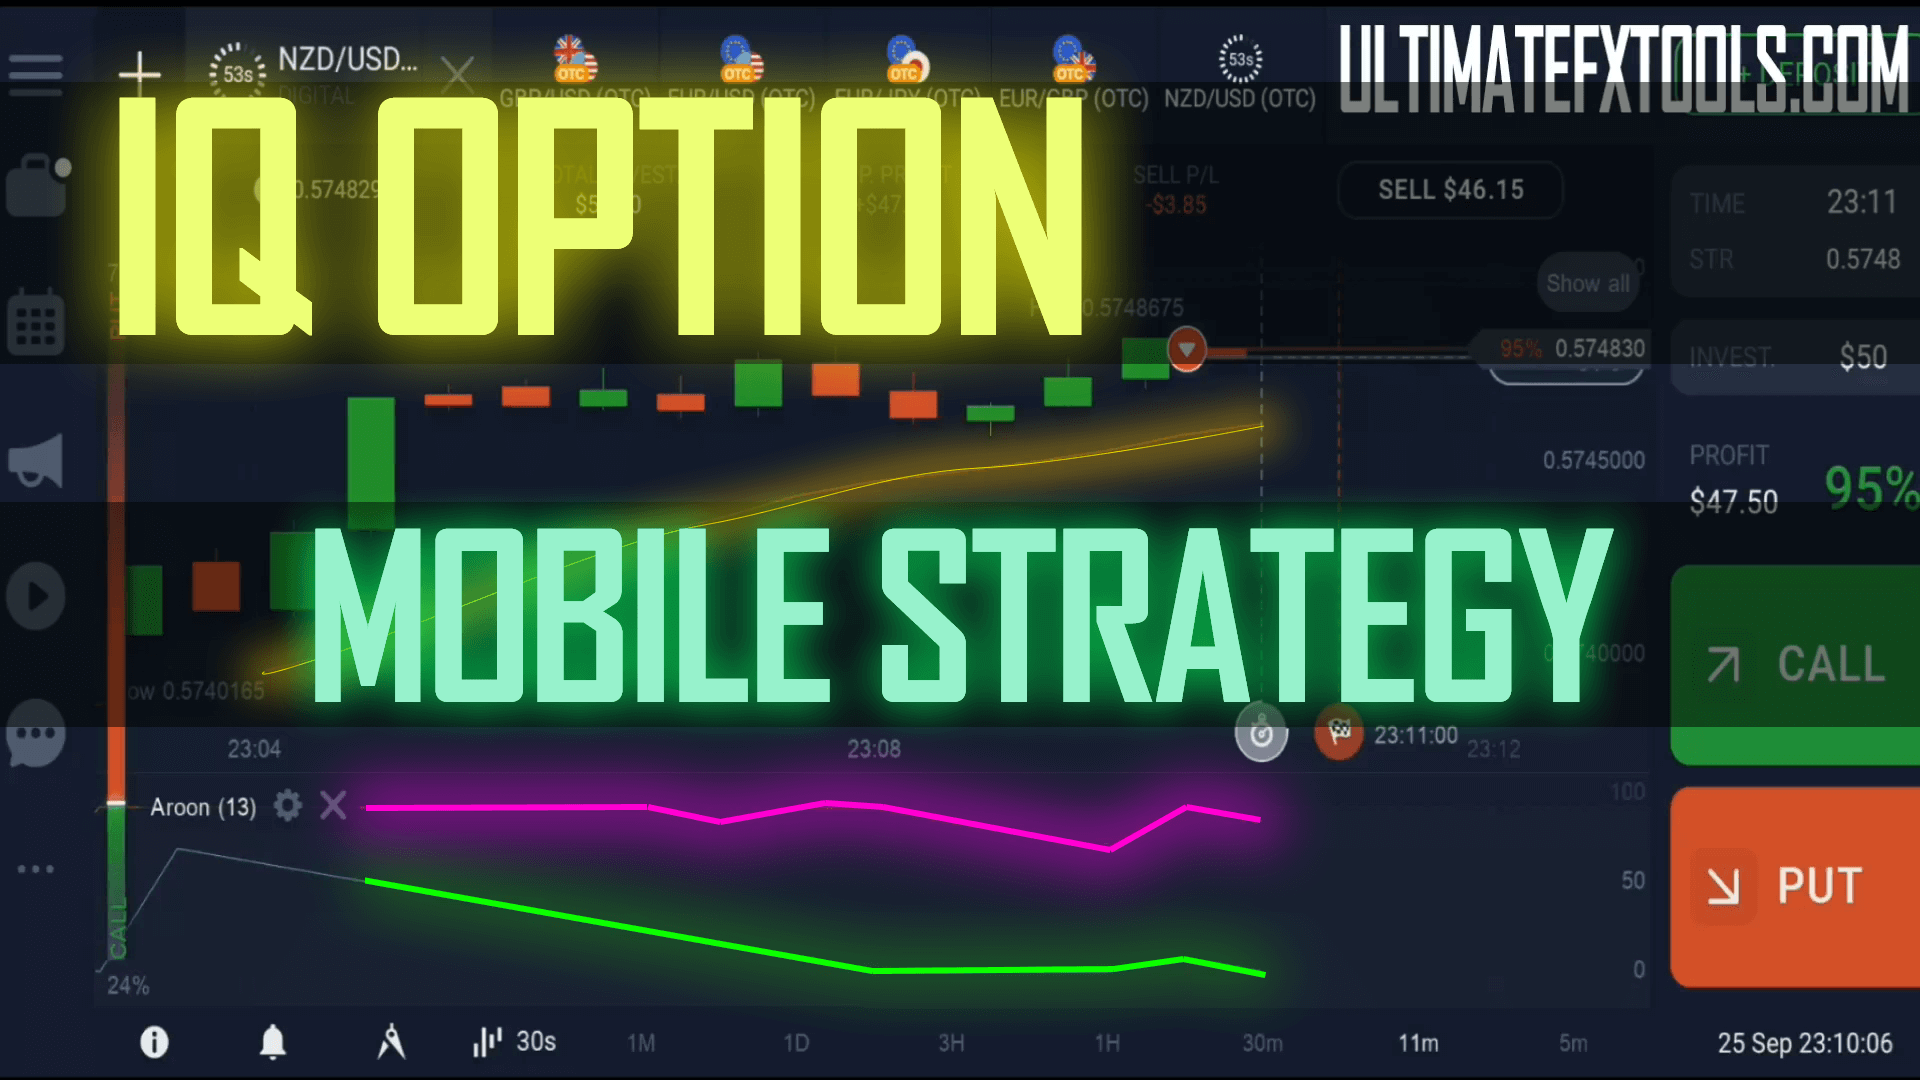
IQ Option Mobile Trading Strategy
Trading on a phone changes which tools you have. The IQ Option mobile app runs its own charting engine, so the technique below is built entirely from indicators that live inside the app — not anything you install on a desktop. The idea is simple: spot a short-term trend reversal on the 30-second chart, confirm it with the app's built-in indicators, and only act when they agree. A 30-second expiry is fast and high variance, so these rules keep you out of weak setups more than into them.
Why Custom Indicators Do Not Work on the Phone
This is the part most mobile guides skip. Custom MetaTrader indicators — the .ex4 and .ex5 files you load into MT4 or MT5 — only run on the Windows desktop terminal. They do not load in the IQ Option app, and they do not load in the MetaTrader mobile apps either. There is no way to drop a custom arrow indicator onto a phone chart. So a genuine mobile strategy has to use the app's own built-in indicators, and IQ Option gives you the standard set: RSI, moving averages, Bollinger Bands and MACD, all from the indicators menu inside the app. Everything below uses only those built-in tools — if you want custom indicators, that stays a desktop job, covered in our IQ Option indicator settings guide.
The Built-In Indicator Setup
Open a liquid pair you already follow, set the candle time to 30 seconds, and add three built-in indicators from the app's indicators menu:
- RSI (period 14) — flags when price is stretched, above 70 or below 30.
- Bollinger Bands (20, 2) — shows when price has pushed to a short-term extreme.
- EMA (period 20) — a single moving average to read the near-term slope.
A reversal candidate appears when price stabs outside the outer Bollinger Band while RSI is already past its extreme, and the very next candle starts pulling back toward the middle band. That pullback is the signal that momentum has stalled, not the stab itself.
How to Read the Reversal on the Mobile Chart
After price pokes outside the band, watch for a candle that closes back inside it — a long wick pointing in the direction of the old move is the cleanest tell. Line that up with RSI turning back from its extreme and you have a stalled trend, not a fresh one. If price is riding the band with RSI pinned high or low, that is a strong trend, not a reversal — exactly where this setup gets you into trouble.
Entry Rules
Keep the rules simple so they can be applied calmly inside a 30-second window:
- Higher (buy): price rejects the lower Bollinger Band, RSI turns up from below 30, and the reversal candle closes back inside the band. Enter on the close of that candle.
- Lower (sell): price rejects the upper Bollinger Band, RSI turns down from above 70, and the reversal candle closes back inside the band.
- Stand aside: price is walking the band, RSI and price disagree, or the candles are flat and directionless. No trade is a position.
Settings at a Glance
- Candle time: 30 seconds
- RSI: 14, levels 70 / 30
- Bollinger Bands: 20, 2
- EMA: 20
- Expiry: match it to the candle (30 seconds), or step up to 1 minute in choppy conditions
When This Setup Fails
No indicator combination removes losing trades, and a 30-second expiry magnifies every bit of noise. The read breaks down on strong trend days, when price rides the outer band and every "reject" candle is just a pause before another push. It also fails around news and in dead, flat ranges where the bands squeeze and RSI hovers near 50. On those days the honest move is to trade less, or not at all. Treat the indicators as decision support: cap your trades per session, stake a small fixed fraction of your balance, and stop at a preset daily loss limit. For a longer-expiry version of this reversal idea, the IQ Option 1-minute strategy gives price more room to confirm, and the MACD trend detector is a useful cross-check on direction.
FAQ
Can I load a custom indicator into the IQ Option mobile app?
No. Custom .ex4 and .ex5 indicators only run in the MT4 / MT5 desktop terminal on Windows. Neither the IQ Option app nor the MetaTrader mobile apps can load them. On a phone you are limited to the built-in indicators the app provides, such as RSI, moving averages, Bollinger Bands and MACD.
Is the 30-second expiry a good place to start?
It is the fastest and most variance-heavy setting on the platform, so it is not the easiest place to build consistency. Many traders read the same reversal signals on the 1-minute chart first, where each candle carries more information, and only shorten the expiry once the rules feel automatic on a demo account.
Do I need to buy anything to use this on mobile?
No — every indicator in this method is already built into the IQ Option app at no cost. Our paid tools are desktop MetaTrader indicators, covered by a single $39 lifetime plan — a separate, desktop-only workflow from the mobile method here.
This content is for educational purposes only. Trading involves risk. Past results do not guarantee future outcomes. Always practice responsible money management and limit your daily trades to avoid large losses.