Why Heikin Ashi + Two EMAs on a 5-Second Chart
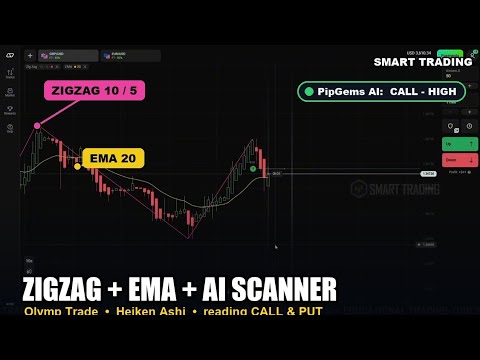
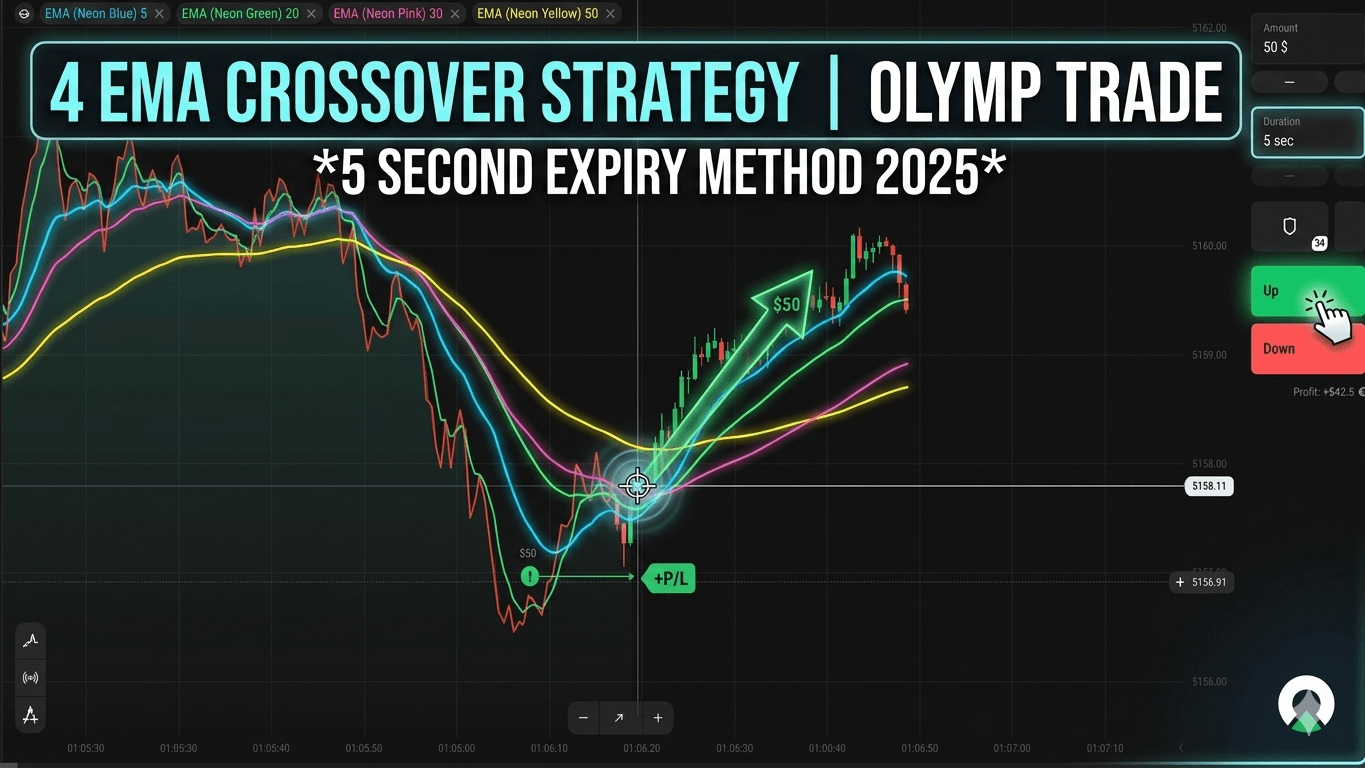
A raw 5-second candlestick chart is mostly noise — wicks everywhere, colors flipping every few candles. This setup tames it with two classic tools. Heikin Ashi candles average the price action so a trend paints as an unbroken run of one color, and a pair of exponential moving averages — EMA 15 (yellow) and EMA 30 (blue) — tells you which side of the market to be on: when the faster yellow line rides above the blue, you only look for CALL entries; when it drops below, you only look for PUT entries.
The third piece is the PipGems AI Chart Scanner. Instead of trusting your own read of a fast-moving chart, you scan it and get back a CALL or PUT prediction with a confidence rating and a short explanation of what the AI sees in the EMAs and the Heikin Ashi candles. It acts as a second opinion, not a blind signal — you still confirm before clicking Up or Down.
Chart Setup on Olymp Trade
- Platform: Olymp Trade (fixed-time trades on crypto OTC pairs)
- Pairs traded: Bitcoin OTC, SHIB OTC, and BNB OTC — all offering a 90% fixed-time payout in the session
- Candles: Heikin Ashi, 5-second timeframe
- Indicators: EMA 15 (yellow line) and EMA 30 (blue line)
- Trade duration: 45 seconds (the session starts at 1 minute, then settles on 45 seconds)
- Stake: fixed $50 per trade
Configuring the AI Scanner
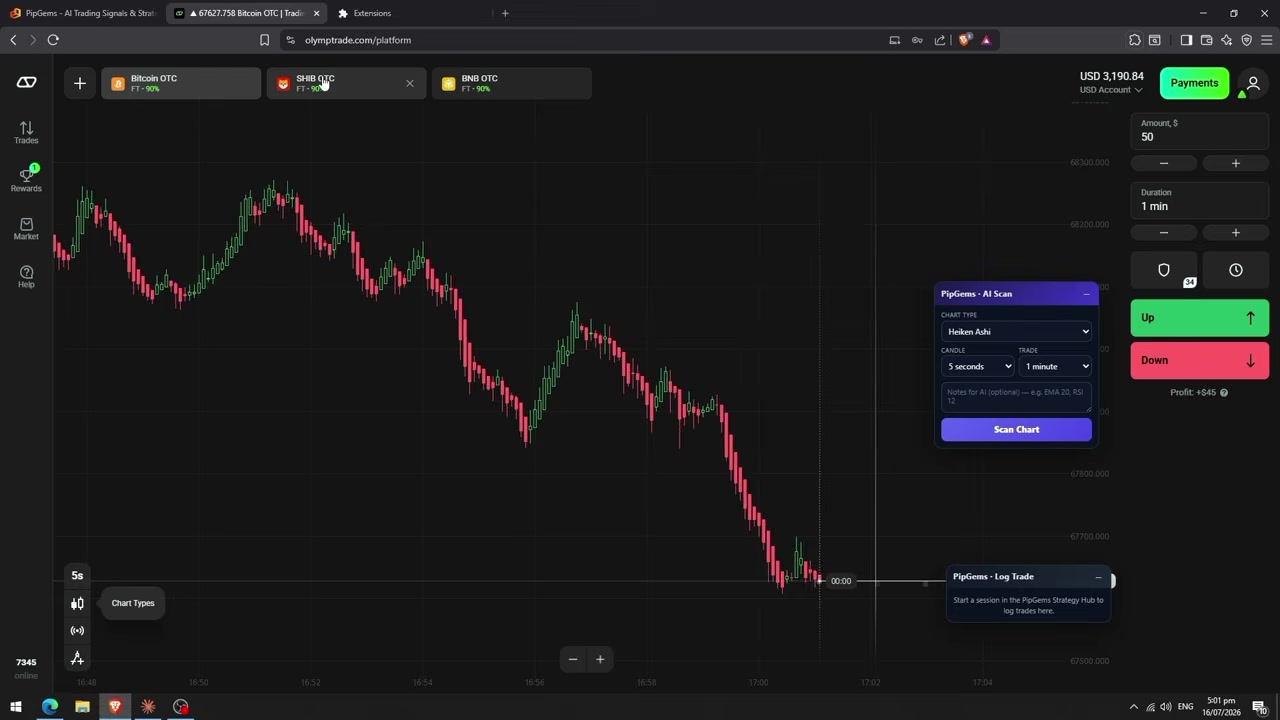
Before the first scan, the PipGems AI Scan panel needs to know what it is looking at. This is the exact configuration used in the video:
- Chart Type: Heiken Ashi
- Candle Timeframe: 5 seconds
- Target Trade Duration: 45 seconds
- Notes for AI: "EMA 15 - Yellow Line, EMA 30 - Blue Line" — naming the indicators and their colors lets the AI reference them directly in its analysis
Reading the CALL & PUT Signals
Each scan returns a prediction (CALL or PUT), a confidence level (Medium or High in this session), and a set of observations explaining the read. The reasoning tracks the exact rules of the strategy:
- "EMA 15 (yellow) and EMA 30 (blue) are aligned bearishly, with the EMA 15 remaining below EMA 30 and both sloping downwards" → PUT (Medium confidence)
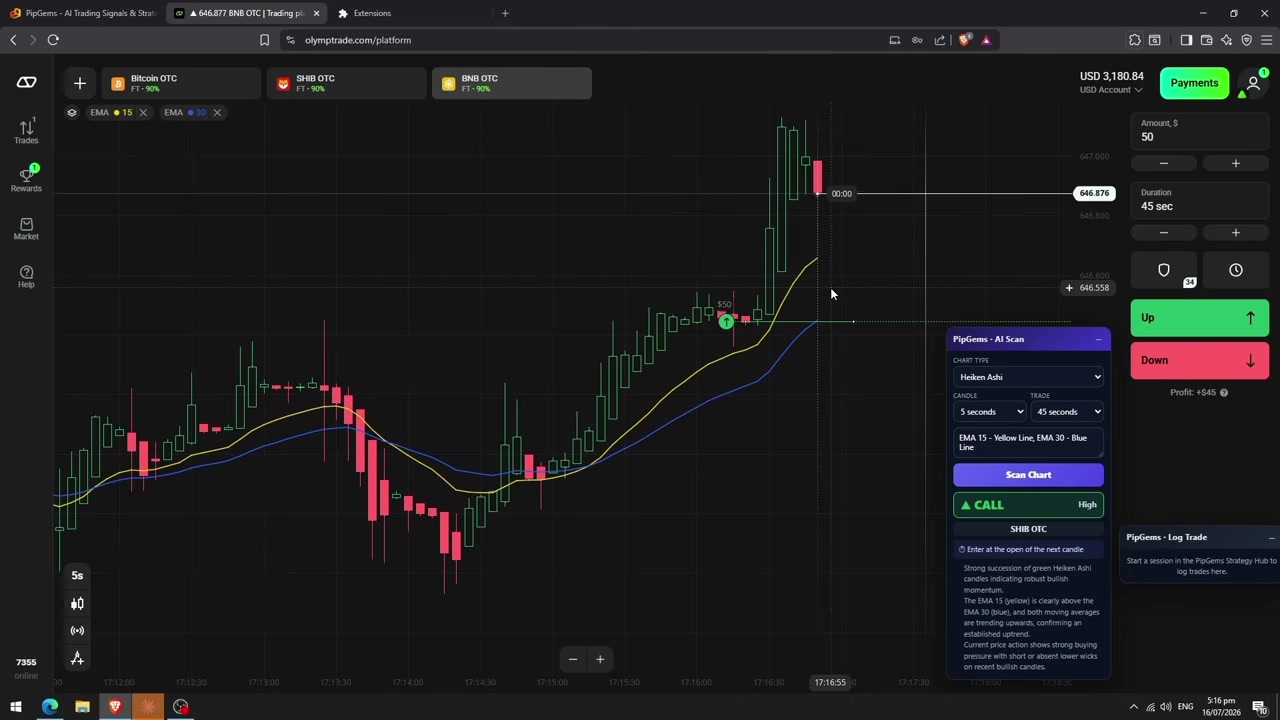
- "The EMA 15 (yellow line) has crossed above the EMA 30 (blue line), confirming a bullish trend reversal — price action shows the candles trading well above both EMAs" → CALL (High confidence)
- "Strong succession of green Heiken Ashi candles indicating robust bullish momentum... both moving averages are trending upwards, confirming an established uptrend" → CALL (High confidence)
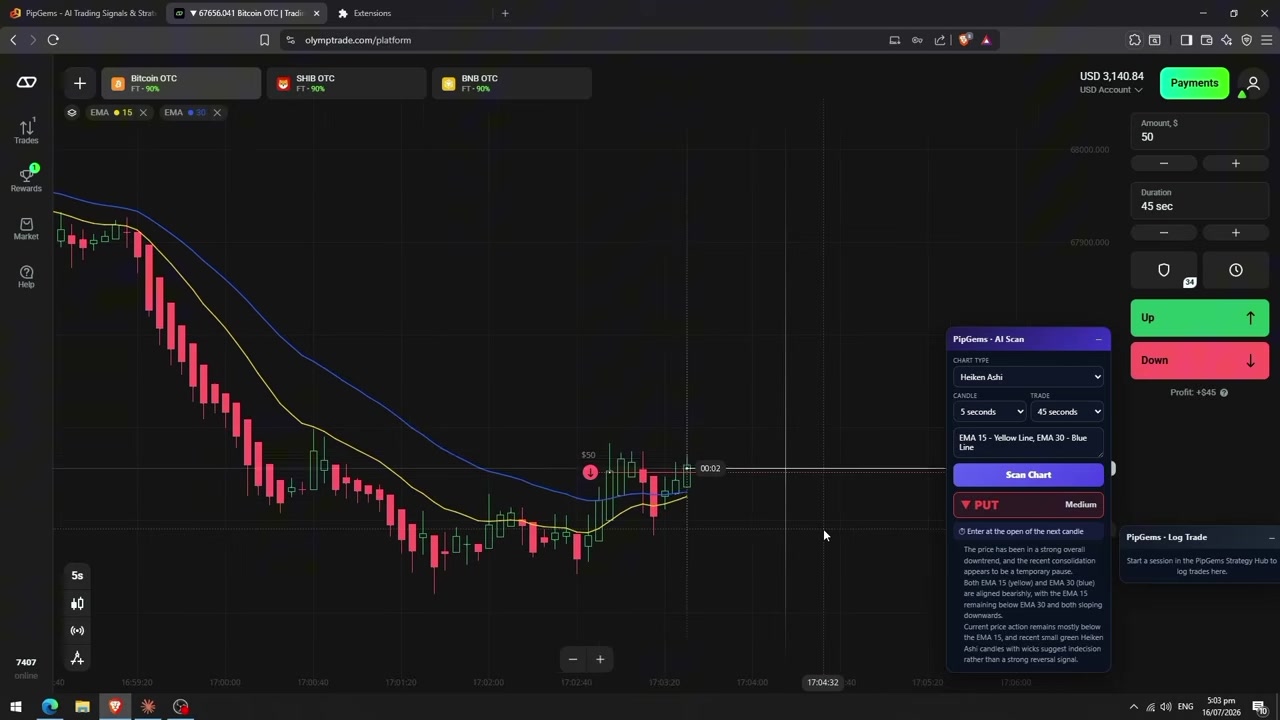
The difference between Medium and High matters. The Medium-confidence PUT above comes with a caveat in the AI's own notes — recent candles show indecision — while the High-confidence CALLs fire when the crossover, the slope of both EMAs, and the candle color all agree. Treat Medium as "wait for one more confirming candle" and High as "the setup is clean."
The Live Session — Wins and a Loss
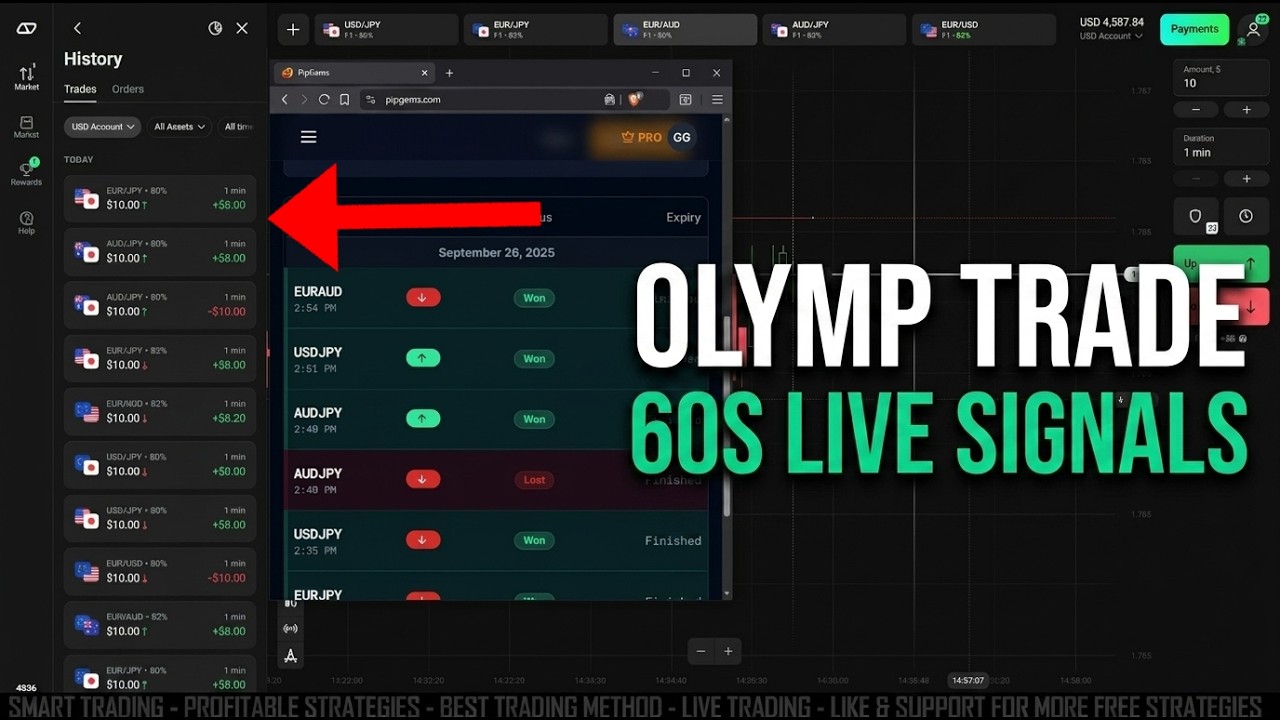
The video runs the setup live with fixed $50 stakes across three crypto OTC pairs. It starts on Bitcoin OTC, moves to SHIB OTC when a clean bullish crossover appears there, and later takes an uptrend continuation on BNB OTC. Winning trades at the 90% payout return about $45 each — and there is a losing trade shown on screen too, a full -$50 on a Bitcoin OTC entry. The balance works its way from roughly $3,140 to $3,225 across the frames shown, which is exactly the honest picture: the EMA filter keeps you on the right side of the trend most of the time, but a 45-second expiry on a 5-second chart will still hand you losers.
Watch the Full Live Session
See the scanner configuration, every EMA crossover, and each trade from entry to expiry — including the loss:
Risk Management Rules
- Only trade in the direction of the EMA alignment — no counter-trend entries, even if a candle looks tempting.
- Treat Medium confidence signals as optional; skip them when the AI's own notes mention indecision.
- Keep the stake fixed (the video uses a constant $50, about 1.5% of the balance) — never increase it to chase back a loss.
- Cap your session: a few clean crossover trades beat an hour of forcing entries on a fast chart.
- Practice the scan-confirm-enter routine on a demo account before risking real funds.
The Verdict
This setup earns a 4 out of 5. The combination is coherent: Heikin Ashi smooths the 5-second noise, the EMA 15/30 pair gives an objective trend filter, and the AI scanner's explanations consistently reference the same crossover logic you can verify with your own eyes — plus the session shows a real $50 loss instead of pretending losses don't happen. What keeps it from a perfect score is the pace: 45-second expiries on a 5-second chart demand quick execution, and each entry still needs a manual scan-and-confirm loop. A strong choice for traders who already understand EMA crossovers and want an AI second opinion on fast fixed-time trades.
#OlympTrade #HeikinAshi #EMA #5SecondStrategy #PipGems #AIScanner #FixedTimeTrades #CryptoOTC #TradingSignals
This content is for educational purposes only and is not financial advice. Trading involves substantial risk; you can lose some or all of your capital. No result is guaranteed and past performance does not indicate future results. Trade only what you can afford to lose.