Pocket Option Accelerator Oscillator Strategy
The Accelerator Oscillator (AC) is a Bill Williams indicator that measures something most tools ignore: the acceleration or deceleration of momentum itself. Rather than tracking price direction, it tracks how quickly that driving force is speeding up or slowing down. Because momentum usually shifts before price does, the AC often changes direction ahead of the candles — which makes it an early-warning tool, but also one that fires plenty of false signals. Read this first: the AC is a confirmation tool, not a standalone entry. You still confirm the context and manage risk on every trade.
How to Read the Accelerator Oscillator Histogram
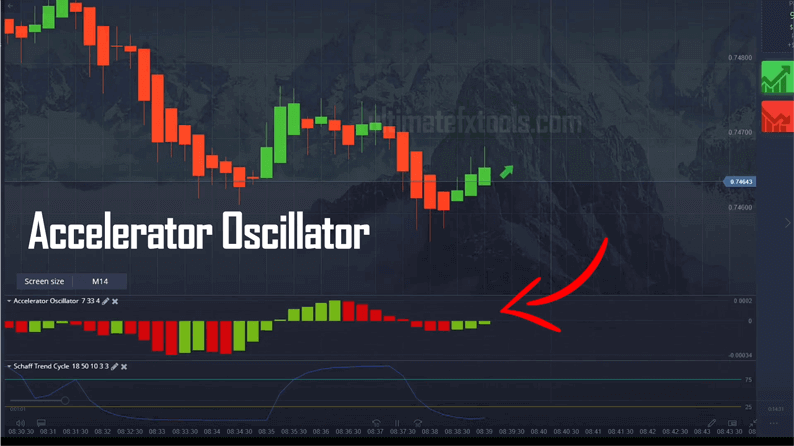
The AC is plotted as a histogram of bars above and below a central zero line. Two things matter: the colour of each bar and its position relative to zero. A green bar means the current bar is higher than the one before it — momentum is accelerating; a red bar means it is lower, so momentum is decelerating. Bars above the zero line show the driving force is broadly positive; below zero it is negative. Bill Williams' guidance is simple: do not buy while the latest bar is red, and do not sell while it is green, because the colour shows momentum moving against your intended direction. Watch the colour changes and zero-line crossings rather than the exact height of any bar.
Adding the Schaff Trend Cycle as a Filter
The Schaff Trend Cycle (STC) sits underneath as a second opinion. It combines MACD-style trend measurement with a cycle calculation and an EMA to produce a smoother line that swings between an upper and a lower band. The STC is slower than the AC, so together they help you avoid acting on a colour change the wider trend does not support. When the STC is turning up from its lower band and the AC agrees, the setup is cleaner; when they disagree, the AC signal is treated as noise and skipped. Filtering out those conflicting alerts is the biggest factor in trading with more consistency.
Setup and Recommended Settings
Keep the Accelerator Oscillator on its default period so the histogram reflects genuine momentum turns rather than every small wiggle. A standard AC uses a 5-period and 34-period momentum calculation with 5-period smoothing; the defaults are fine and rarely need changing. Set the Schaff Trend Cycle to its common defaults (cycle length around 10, with 23 and 50 for the fast and slow EMAs). Trade a small number of liquid pairs you know well, keep the chart uncluttered, and let each candle fully form before you read the histogram.
Entry Logic — Call and Put
The rules are deliberately simple so they can be applied calmly inside a short window:
- Call (up): the AC prints a green bar (momentum accelerating higher), the histogram is rising toward or above the zero line, and the Schaff Trend Cycle is turning up.
- Put (down): the AC prints a red bar (momentum accelerating lower), the histogram is falling toward or below the zero line, and the STC is turning down from its upper band.
- Stand aside: the AC and the STC disagree, or the histogram hovers flat around zero with no clear colour trend. When a green bar appears but the STC still points down, pause and let the chart resolve.
When the Accelerator Oscillator Fails
Because the AC reacts to acceleration, it is at its worst in quiet, ranging markets: the histogram flips colour back and forth across the zero line, printing signal after signal that leads nowhere. It can also turn early during a strong trend, tempting you to fade a move that is still running. That is exactly why it belongs as a confirmation tool and not a trigger on its own. No indicator removes losing trades. Stake a small, fixed fraction of your balance per position, cap the number of trades you take in a session, and stop for the day once you hit a preset loss limit. Practise the rules on a demo account until the reads feel automatic before you risk real funds.
For more Pocket Option methods, see the Pocket Option working strategy, the Schaff Trend Cycle in Quotex Donchian Channel and Schaff Trend Cycle, or the best 5 Pocket Option EMA strategies.
FAQ
Does the Accelerator Oscillator predict price direction?
Not exactly. The AC measures whether momentum is accelerating or decelerating, which often shifts before price turns. That early reading is useful, but it also produces false signals, so treat it as a heads-up to check the chart rather than a forecast.
Can I use the Accelerator Oscillator on its own?
It is better used as confirmation alongside a trend filter such as the Schaff Trend Cycle and basic price structure, because on its own it flips too often in ranging markets. The full set of indicators used in this method is included with the single $39 lifetime plan on the pricing page.
What timeframe works best on Pocket Option?
Match the indicator timeframe to your expiry and keep it consistent. Shorter timeframes give more signals but more noise; a slightly longer reading in choppy conditions filters out weaker bars. Whatever you choose, let candles close before you act.
This content is for educational purposes only. Trading involves risk. Past results do not guarantee future outcomes. Always practice responsible money management and limit your daily trades to avoid large losses.