Pocket Option Strategy Using a 1-Minute Crossover Indicator
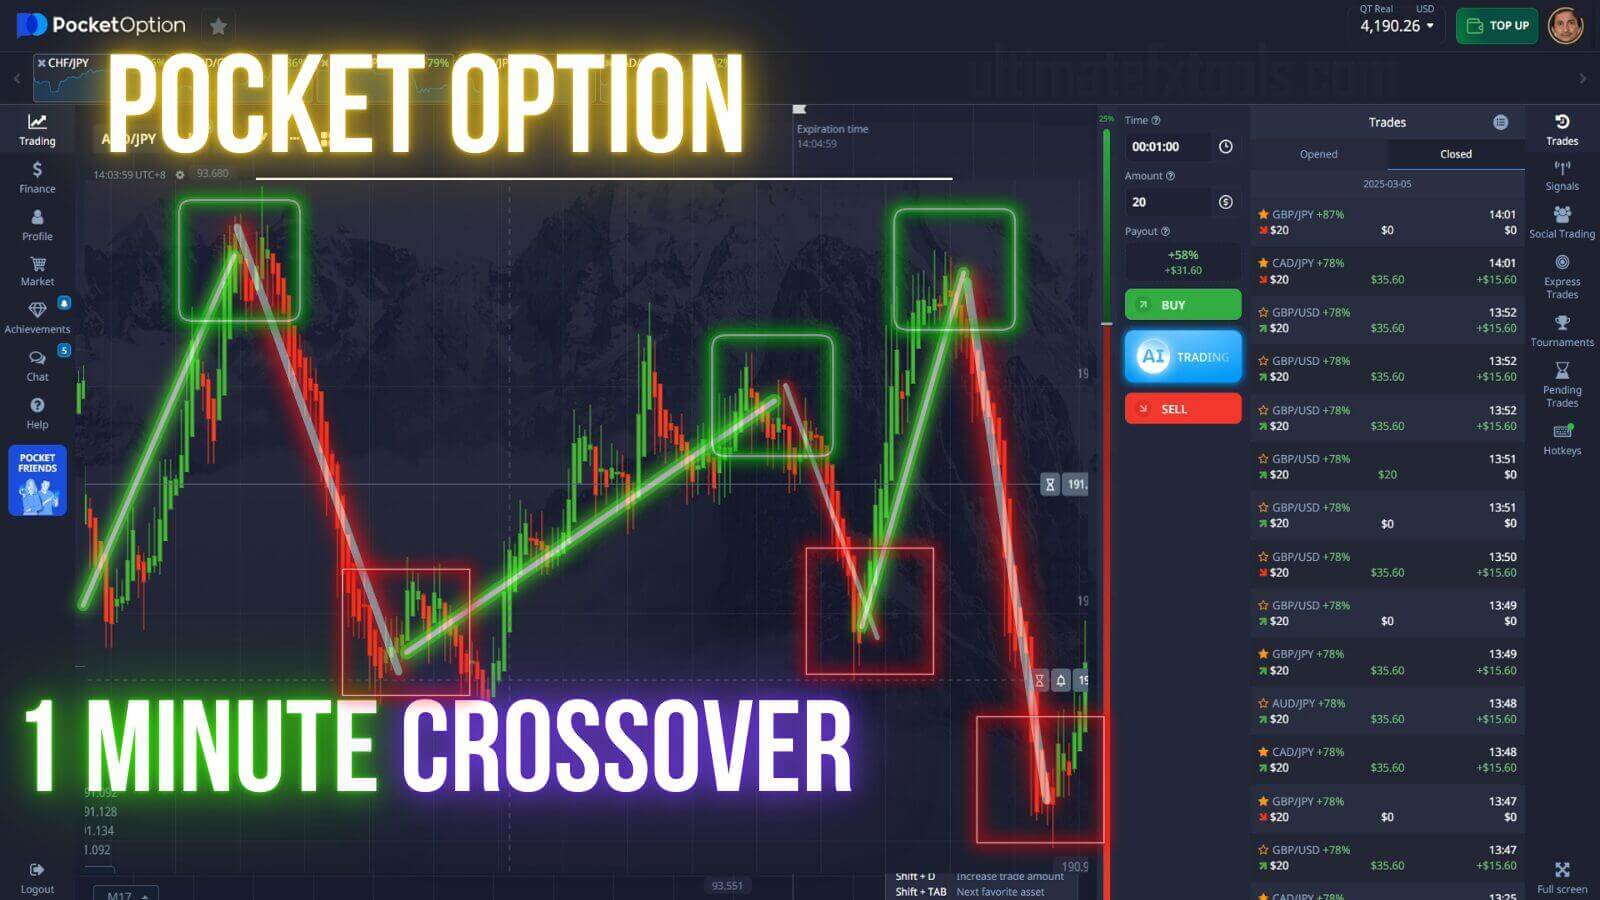
The 1-minute crossover strategy is a fast, chart-based approach for Pocket Option, where each position closes on a fixed expiry and the only question that matters is whether price will be higher or lower when the timer ends. It is built around a moving-average crossover indicator read on the one-minute chart, with the Relative Strength Index (RSI) used as a second opinion. Before anything else, read this plainly: a crossover is decision support, not a promise. It flags a moment worth your attention. You still confirm the context and manage the risk on every trade.
What a Crossover Indicator Actually Measures
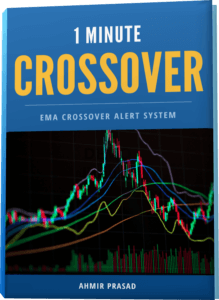
A crossover indicator plots two moving averages, a faster one that reacts quickly to recent candles and a slower one that smooths the broader drift. When the fast line crosses above the slow line, momentum has recently turned up; when it crosses below, momentum has recently turned down. The important word is recently. Moving averages are built from candles that have already closed, so a crossover lags by construction: it confirms a move that has already begun rather than predicting the next one. That lag is not a flaw to be tuned away, it is simply how the tool works, and understanding it is the difference between using the signal well and chasing it.
Where the Crossover Fails
The honest weakness of any crossover method shows up in choppy, sideways markets. When price ranges without direction, the two averages twist around each other and the indicator whipsaws, printing repeated crosses up and then down within a few candles. Each false cross looks like a signal, and on a one-minute expiry there is little time to sort the real turn from the noise. This is why filtering matters more than reacting. Adding RSI as a confirmation layer, and standing aside when the market is flat, removes a large share of the weak signals a crossover alone would hand you.
The Setup and Recommended Settings
Keep the chart clean so the crossover and RSI are easy to read under a short timer. A workable starting point on the one-minute chart is a fast EMA around 5 periods paired with a slower EMA around 20 periods, with RSI set to the standard 14-period length. The two EMAs give you the crossover; RSI tells you whether momentum supports it. Trade a small number of liquid pairs you know well, and let each candle fully close before acting, since an unfinished candle can un-cross before it closes.
Entry Logic and Confirmation
The rules are deliberately simple so they can be applied calmly inside a one-minute window:
- Higher / Call: the fast EMA crosses above the slow EMA, RSI is rising and holding above the 50 midline, and price is above the recent swing low. A green candle closing in that direction adds confidence.
- Lower / Put: the fast EMA crosses below the slow EMA, RSI is falling and below the 50 midline, and price is failing under recent resistance.
- Stand aside: the crossover and RSI disagree, RSI is hovering flat around 50, or price is stuck in a tight range. A cross with no momentum behind it is exactly the whipsaw you want to skip.
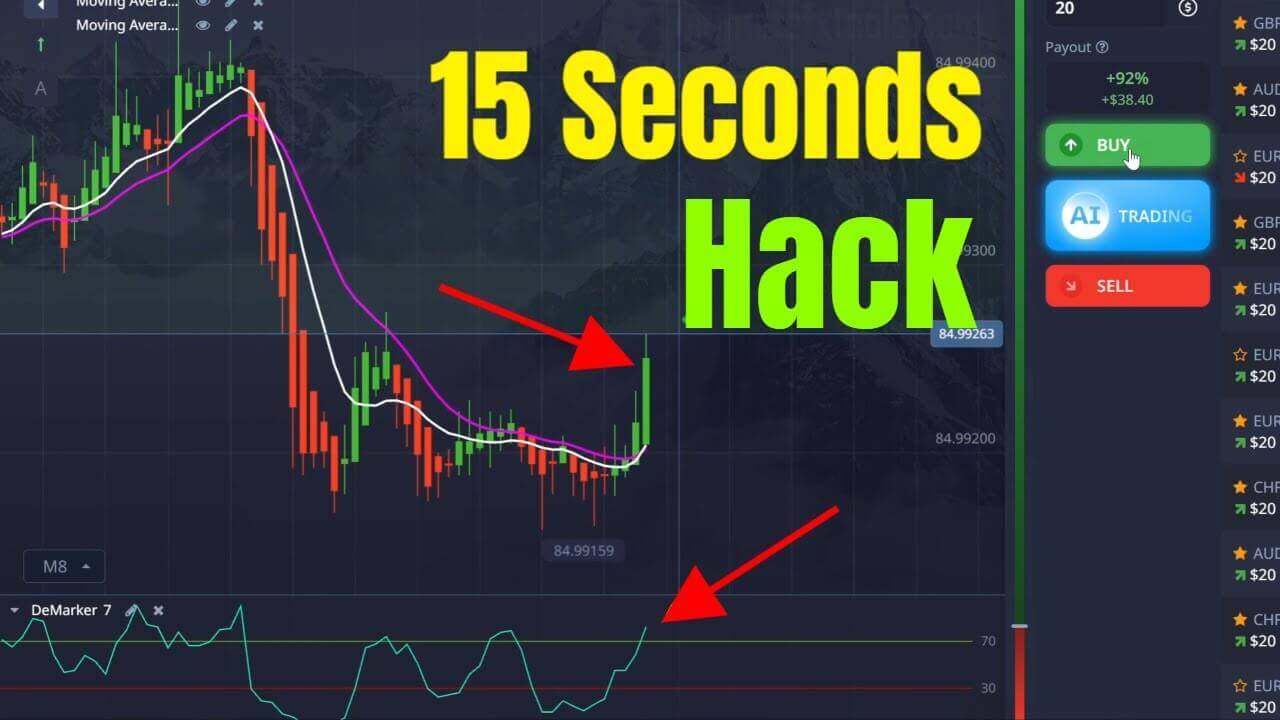
For a different way to read short expiries on the same platform, compare this with the Pocket Option 15-second DeMarker approach and the trend-following Pocket Option Super Trend strategy.
Timeframe, Expiry and Risk
This method is built around the one-minute chart with a one-minute expiry, which matches the pace of the crossover. If conditions turn choppy, stepping up to a two-minute reading cuts down on false crosses by giving each average more room to settle. Whatever expiry you choose, risk control keeps you trading: stake a small, fixed fraction of your balance per trade, cap how many trades you take in a session, and stop once you hit a preset loss limit. Never try to recover a loss by doubling the next stake; that martingale-style escalation compounds risk fast and can wipe out an account in a short losing streak. No indicator removes losing trades, so the aim is steady, repeatable decisions and greater consistency, not one big result. Practice the rules on a demo account until the reads feel automatic before risking real funds.
FAQ
Does a crossover indicator predict the next move?
No. It reacts to candles that have already closed, so it confirms a move that has already started rather than predicting one. Treat each cross as a prompt to check the wider context, not as a forecast.
Why do I get so many false signals on the 1-minute chart?
Fast timeframes and ranging markets produce whipsaws, where the averages cross back and forth without a real trend. Confirming with RSI and standing aside when price is flat filters out most of them.
Do I need to buy anything to try this?
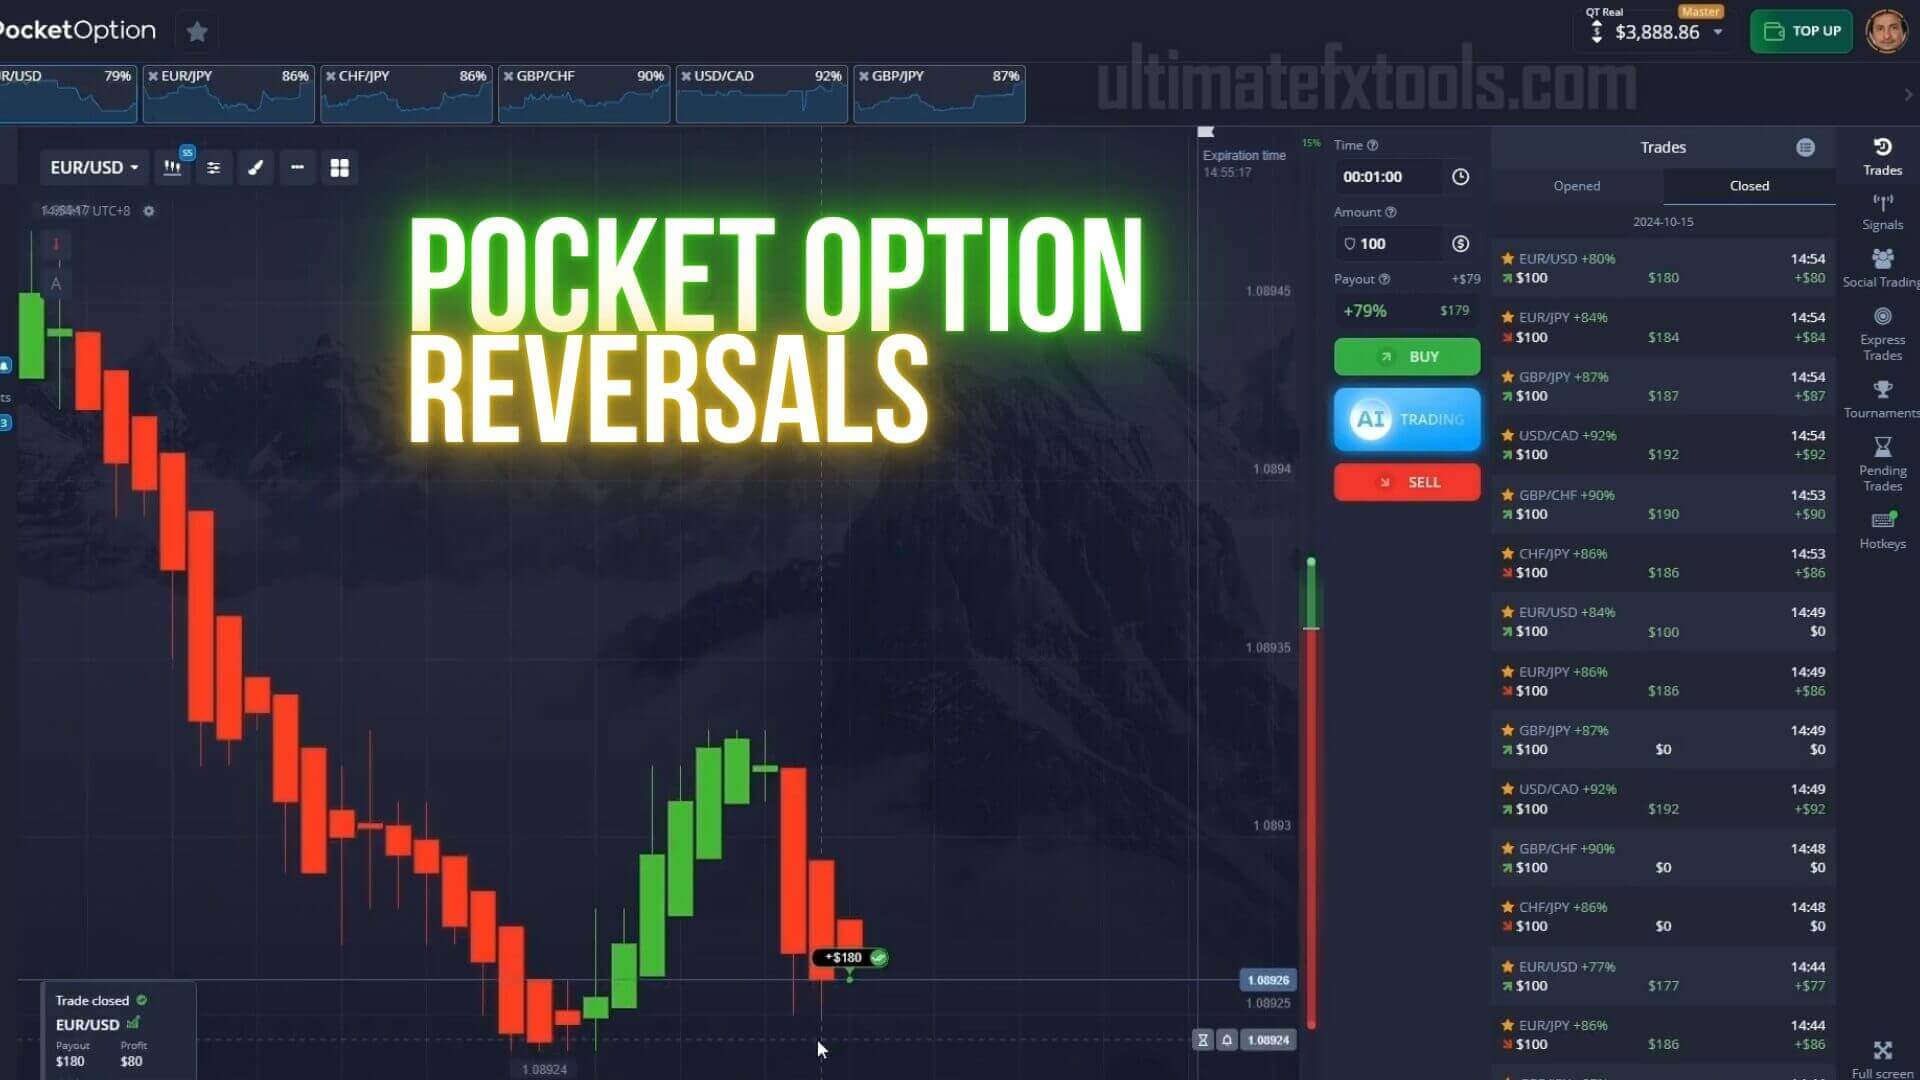
You can test the idea with standard EMA and RSI tools on a demo account first. If you want the full indicator library, every tool on the site is included with a single $39 lifetime plan. For more short-expiry ideas, see the 5 reversal strategies for Pocket Option.
This content is for educational purposes only. Trading involves risk. Past results do not guarantee future outcomes. Always practice responsible money management and limit your daily trades to avoid large losses.