5 Reversal Strategies Pocket Option
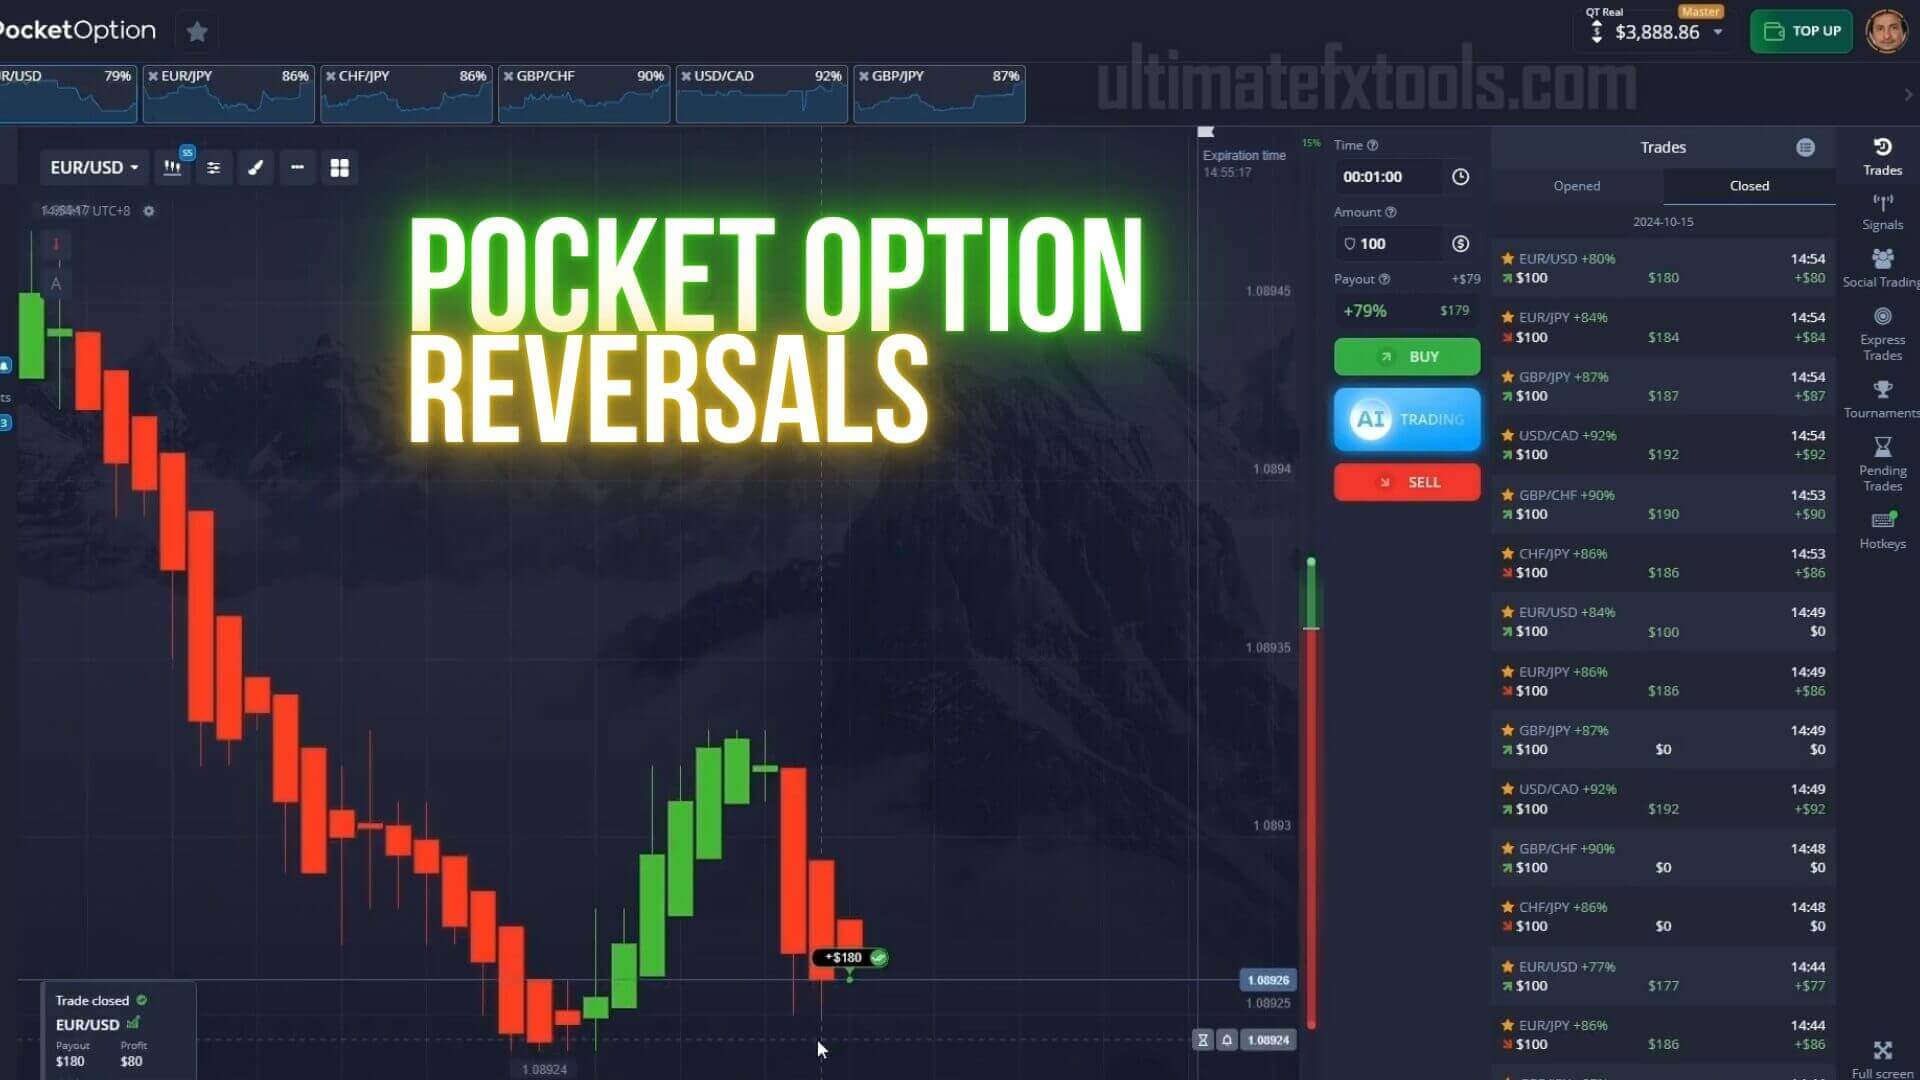
Reversal trading means catching the moment a price turn happens — entering when an asset has stretched too far in one direction and looks ready to snap back. On Pocket Option, where trades run from seconds to a few minutes, short expiries reward precise timing at overextended prices. Instead of riding a trend, you wait for exhaustion and trade the rotation back toward a balanced level.
Reversal setups tend to beat trend-following when the market is ranging. In a sideways market trend tools give late or conflicting signals, while overbought and oversold readings become far more meaningful. Here are five reversal-style approaches traders commonly use on Pocket Option.
1. RSI Overbought and Oversold Bounces
The Relative Strength Index (RSI) measures how fast and how far price has moved recently. Above 70 the market is considered overbought; below 30, oversold. A reversal trader waits for RSI to reach one of these zones and then cross back toward the middle before entering against the recent move; in a strong trend, though, RSI can stay pinned for a long time. For RSI paired with a momentum filter, see our Pocket Option RSI and Bulls Power strategy.
2. Bollinger Bands Rejection
Bollinger Bands plot a moving average with an upper and lower band based on volatility, and in a range price frequently touches a band and rotates back toward the middle line. The setup: wait for a candle to pierce the upper or lower band, then for the next candle to close back inside the bands before entering toward the midline. A single band touch alone is not a signal — the closing candle is the confirmation. We break down a similar setup in our Bollinger Bands and Candle Bars strategy.
3. DeMarker with a Moving Average Filter
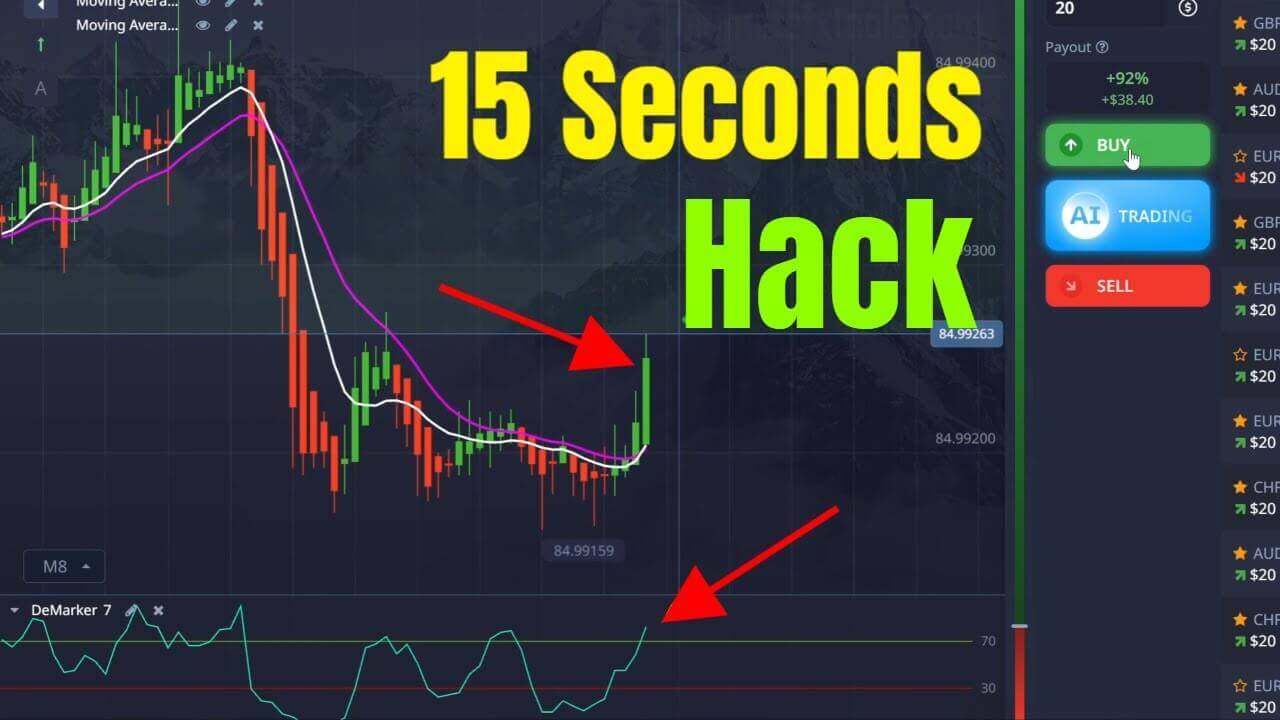
The DeMarker oscillator compares recent highs and lows to estimate buying and selling exhaustion, with readings near 0.7 suggesting overbought conditions and near 0.3 oversold. Because DeMarker can flag turns early, many traders add a moving average filter and only take reversals that agree with the slower line, cutting down on premature entries during momentum bursts. Our Pocket Option Moving Averages with DeMarker strategy shows one way to set this up.
4. Parabolic SAR Flip
Parabolic SAR plots dots above or below price; when the dots flip sides, it signals a potential change in direction. On short Pocket Option timeframes, a SAR flip near a known support or resistance level is a classic reversal cue. The main weakness is chop — in very flat markets SAR flips constantly, so it pairs best with a range that still has clear swing highs and lows. See our 1 Minute Reversals with Parabolic SAR guide — the same logic applies on Pocket Option charts.
5. ZigZag Swing Structure
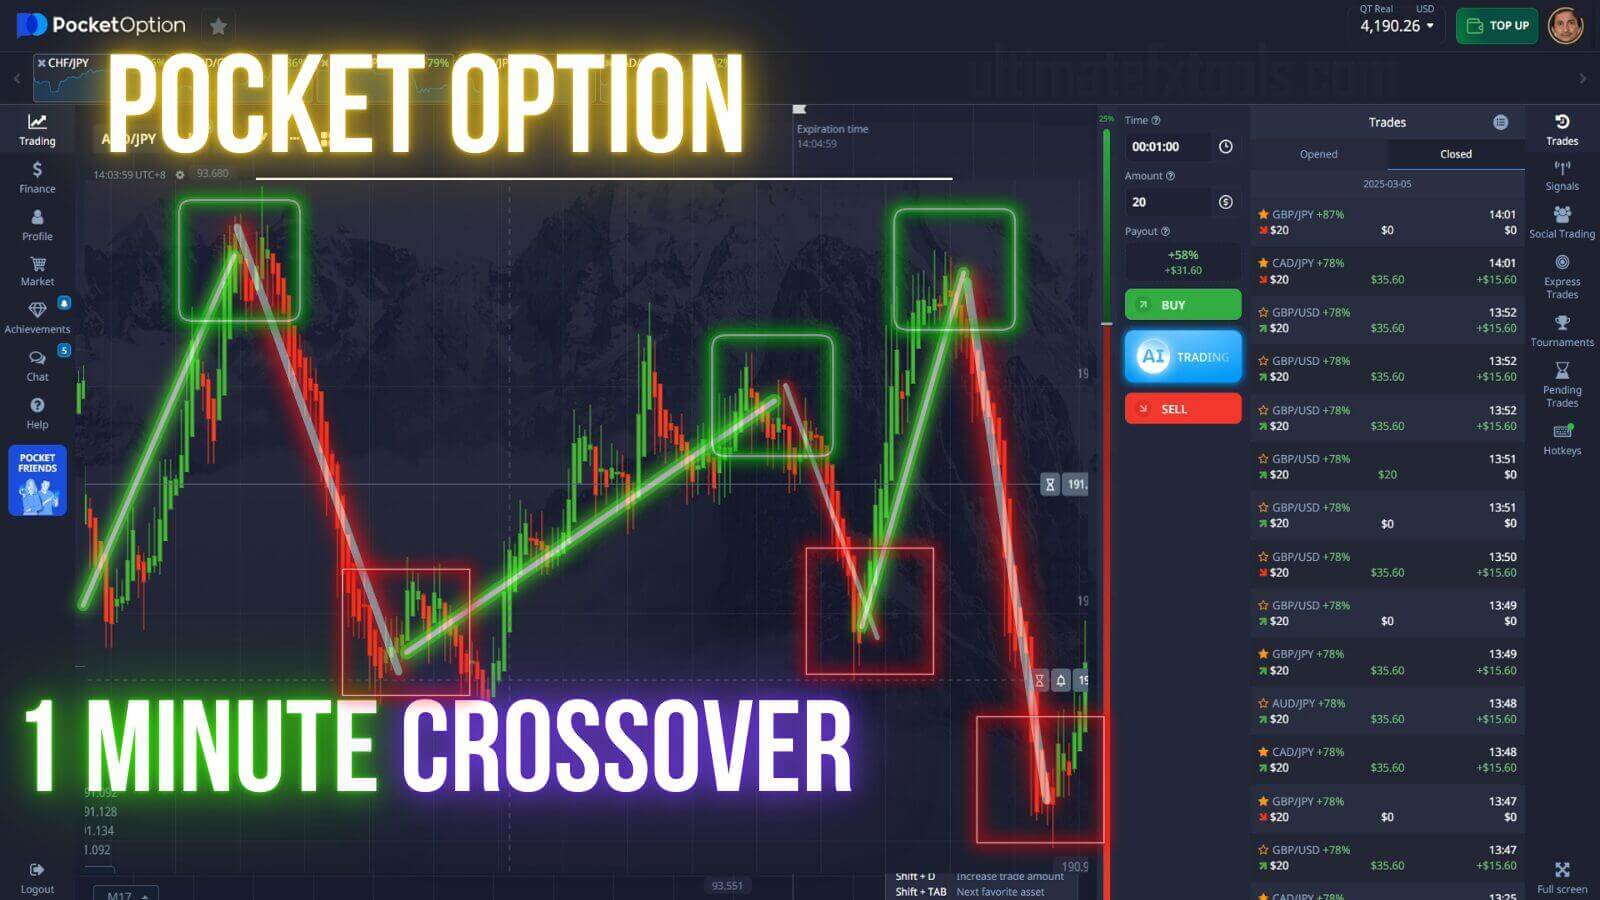
The ZigZag indicator filters out small fluctuations and draws lines only between significant swing highs and lows, making the range structure easy to see. Reversal traders use it to identify where previous turns occurred, then watch for price to return to those levels and stall. Because ZigZag repaints its most recent leg, treat it as a map of the range rather than a standalone entry trigger, and combine it with a confirming oscillator. Our 2 Lines ZigZag strategy shows this pairing in practice.
When Reversal Trading Works Best
All five approaches share the same ideal environment: a ranging market where price oscillates between visible support and resistance, because that is where overextended readings genuinely tend to revert. During a strong trend, reversal signals fire repeatedly against the move and get run over — that is when trend-following tools are the better choice.
- Check the higher timeframe first: if price is making consistent higher highs or lower lows, skip reversal setups.
- Always wait for the signal candle to close before entering — mid-candle signals frequently disappear.
- Prefer levels that have already produced at least one prior turn in the current session.
FAQ
How do I know the market is ranging?
Look at the last 30 to 50 candles. If price is bouncing between a visible ceiling and floor and a moving average like the EMA 50 is roughly flat, you are in a range. If the average is clearly sloped and price keeps closing on one side of it, treat it as a trend and skip reversal entries.
What timeframe should I use for reversal trades on Pocket Option?
Most traders read the setup on the 1-minute or 5-minute chart and match the expiry to roughly one to three candles of that timeframe. Very short expiries of 5 to 15 seconds leave no room for the turn to develop, so start at 1 minute and only shorten once your entries are consistent.
Do I need paid tools, or are free indicators enough?
Every indicator mentioned here — RSI, Bollinger Bands, DeMarker, Parabolic SAR, and ZigZag — is built into most charting platforms for free, so you can practice all five setups without spending anything. Paid tools mainly add convenience: pre-tuned settings, visual signals, and alerts. If you want that, our $39 lifetime package includes over 100 indicators and strategy files in one download, but the free versions are a good place to start.
This content is for educational purposes only. Trading involves risk. Past results do not guarantee future outcomes. Always practice responsible money management and limit your daily trades to avoid large losses.