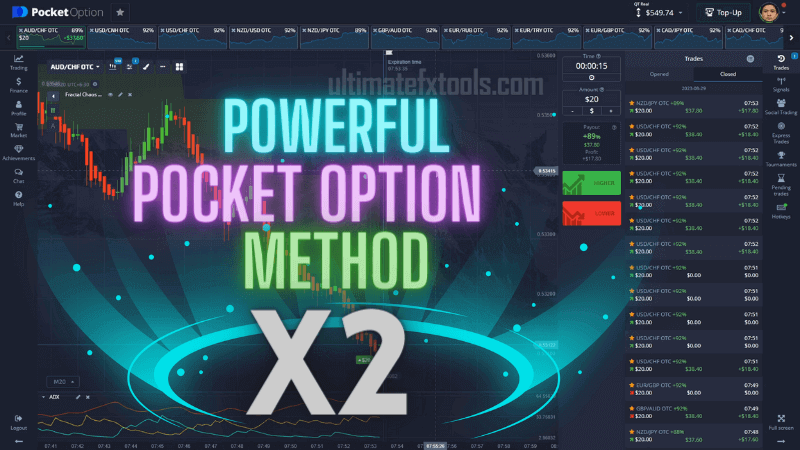
Most losing trades come from a cluttered chart, not a missing indicator. Stacking a dozen tools tends to produce conflicting signals and hesitation at the exact moment a decision is needed. This Pocket Option approach goes the other way: it uses only two indicators, Fractal Chaos and the ADX (Average Directional Index). We call it "powerful" not because it wins on its own, but because a simpler chart is easier to read consistently and easier to follow with discipline.
Powerful Pocket Option Strategy with Only 2 Indicators: Fractal Chaos and ADX Indicator
The two indicators do genuinely different jobs, which is why pairing them adds information rather than repeating it. Fractal Chaos describes price structure and where a breakout may occur; ADX describes how much strength is behind a move. One tells you where, the other tells you how strongly. Because they measure separate things, agreement between them is real confirmation, not two versions of the same signal.
What Fractal Chaos Does
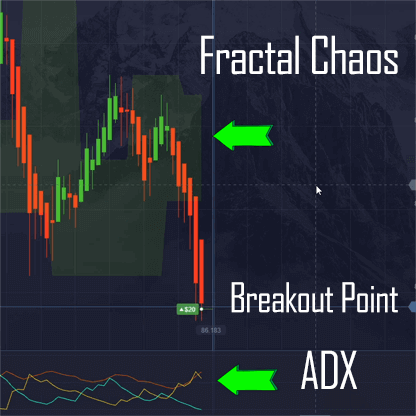
Fractal Chaos is a technical analysis tool used to map market structure. It draws a band, often described as a "box," around recent swing highs and lows. When candlesticks sit inside the box, price is consolidating. When a candle closes outside the box, it flags a possible breakout from that range. In this strategy, the trigger is a candle breaking clearly outside the Fractal Chaos box, which marks the spot worth watching.
What the ADX Indicator Does
The ADX measures the strength of a trend, not its direction. A rising ADX suggests momentum is building; a low, flat ADX suggests a weak or ranging market where breakouts are more likely to fail. A common reference level is 25: readings above it point to a trending environment. On its own ADX won't tell you whether to buy or sell, which is exactly why it works well alongside a structure tool like Fractal Chaos.
How to Combine Them Into Entries
Because the two indicators answer different questions, the setup only makes sense when both line up. A simple, repeatable checklist:
- Set up your chart with both the Fractal Chaos box and the ADX indicator.
- Wait for a candle to close outside the Fractal Chaos box, signalling a break from the range.
- Confirm the ADX is rising and above roughly 25, showing there is strength behind the move.
- Read direction from price itself: a break to the upside favours a call, a break to the downside favours a put.
- If ADX is flat or below 25, treat the breakout as unconfirmed and skip it.
Timeframes and Realistic Expectations
The demonstration uses very short candles, which magnifies both the moves and the noise. Fast timeframes react quickly but produce more false breakouts, so many traders test the same rules on a longer candle before committing. Whatever the speed, no indicator combination removes uncertainty. Some valid setups will still lose, and the goal is a process you can repeat calmly, not a signal that is right every time. If you like this style of confirmation logic, compare it with the Momentum and Schaff Trend Cycle setup or the Pocket Option burst trading method.
Risk Management
The two-indicator setup only stays sustainable if position sizing is controlled. Risk a small, fixed amount per trade so a normal run of losing trades cannot damage your account, and decide your maximum daily loss before you start. Avoid martingale, doubling stake size after a loss to chase it back. It can wipe out an account quickly because a short losing streak grows the required stake far faster than most balances can absorb. Treat the short candle times as higher-risk by nature, and practise on a demo account until the checklist feels automatic. For a reversal-focused variation on the same discipline, see the critical reversal strategy.
Does this strategy win every trade?
No. No strategy wins every trade. Fractal Chaos and ADX filter for higher-quality breakouts, but false signals and losing trades are a normal part of trading. Sound risk management is what keeps those losses survivable.
Why only two indicators instead of more?
Because these two measure different things, structure and trend strength, they complement each other without cluttering the chart. Adding more tools of the same type often just repeats a signal and slows down your decision rather than improving it.
Can I use this setup on other platforms or timeframes?
Yes. Both indicators exist on most charting platforms, so the same rules can be tested on longer candles or other markets. Always demo-test any change before trading it live, since behaviour shifts with the timeframe.
Want the full toolkit? Our $39 lifetime access includes 100+ indicators and strategies for MT4 and MT5, updates included.
This content is for educational purposes only and is not financial advice. Trading involves substantial risk; you can lose some or all of your capital. No result is guaranteed and past performance does not indicate future results. Trade only what you can afford to lose.