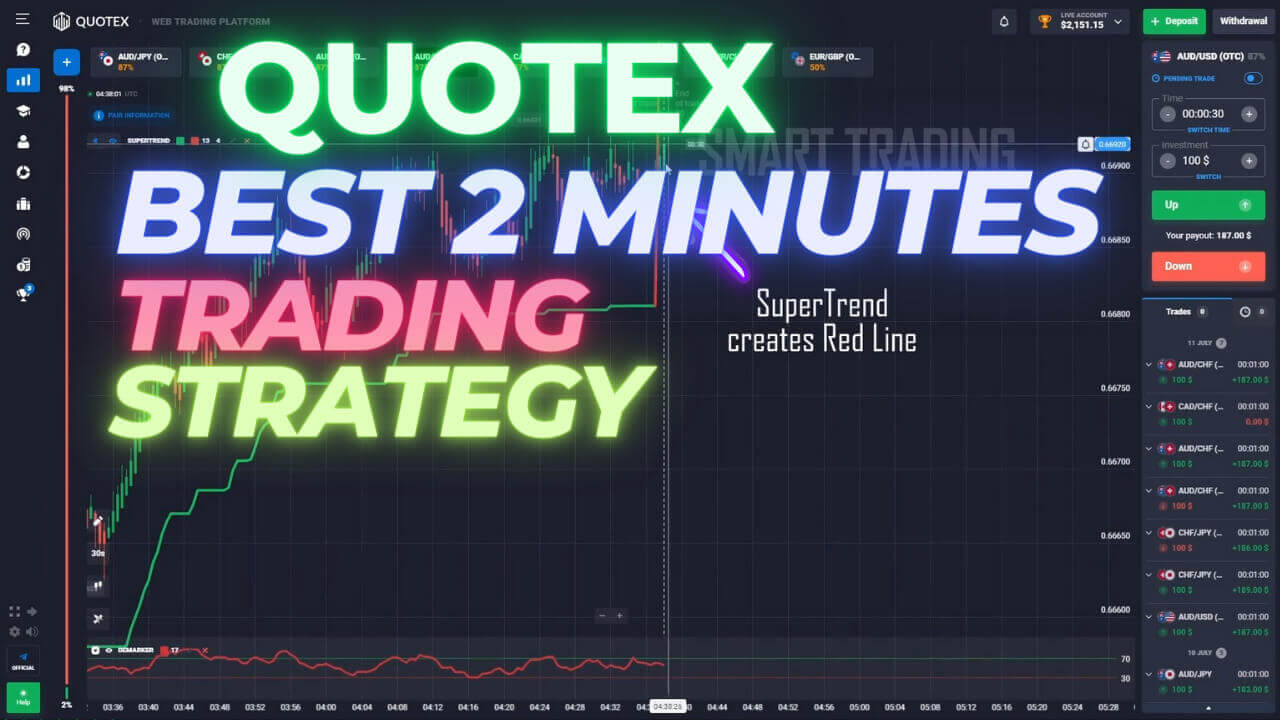
Quotex Strategy with 2 Exponential Moving Average
The 2 EMA strategy for Quotex is one of the simplest trend tools a short-expiry trader can put on a chart: plot two exponential moving averages of different lengths and watch for the moment they cross. When the faster line crosses above the slower line, recent price is pushing up faster than the longer average; when it crosses below, momentum has rolled over to the downside. It is easy to read, which is why it is popular for two-minute Quotex trades. It is also worth being clear-eyed about what the method can and cannot do before you risk money on it.
What the Crossover Actually Marks
An EMA crossover is a lagging signal. Both lines are built from prices that have already printed, so the cross confirms a move that is already underway rather than predicting the next one. That is a feature, not a bug — it filters out a lot of random noise and keeps you on the side of the prevailing move. The trade-off is that you are never in at the very start of a swing, and in a market that is drifting sideways the two lines will tangle and cross back and forth repeatedly. Those repeated false crosses are called whipsaws, and they are the main way this strategy loses money. Knowing that ranging conditions are the weak spot tells you exactly when to stand aside.
Settings and Setup
The two averages are what make the method. Use these periods:
- First EMA Period: 10 — the faster line that reacts to recent price
- Second EMA Period: 40 — the slower line that tracks the broader trend
Apply both to a one-minute Quotex or MetaTrader chart, since a two-minute expiry gives each signal a little room to develop. A clean chart carrying just the two EMAs is far easier to read under a short timer than one cluttered with extra indicators. If you want a second opinion on direction, a standard MACD can sit underneath as a confirmation filter, but the crossover itself is the trigger.
Entry Logic
- Call (up): the 10 EMA crosses above the 40 EMA and price is holding above both lines. Wait for the candle that produced the cross to close before you act, so a single wick does not fake you out.
- Put (down): the 10 EMA crosses below the 40 EMA and price is trading under both lines.
- Stand aside: the two EMAs are flat, close together and repeatedly touching. That is a ranging market, and it is where the crossover is least reliable. No trade is a position too.
When the Strategy Fails
The setup struggles in three situations: quiet, low-volatility sessions where price chops around a flat pair of EMAs; sharp news spikes that jump straight through both lines and then reverse; and the moment right after a strong trend ends, when the last crossover fires late into an exhausted move. None of these can be fully avoided, so the real edge is risk management. Stake a small, fixed fraction of your balance on each trade, cap how many trades you take in a session, and set a daily loss limit you actually respect. Practise the rules on a Quotex demo account until you can tell a clean cross from a whipsaw before you commit real funds — that habit does more for consistency than any tweak to the settings.
If you want to go deeper on the same idea, see how a pure cross behaves in this binary options EMA crossover guide, compare it with the PipGems 2 EMA Quotex approach, and study two-line variations in this two-EMA Olymp Trade method and a 2 EMA and RSI scalping setup.
FAQ
Does a 2 EMA crossover predict the next move on Quotex?
No. Both EMAs are calculated from prices that have already closed, so a crossover confirms a move that is already happening rather than forecasting the next one. Treat it as confirmation of direction, not a crystal ball, and always wait for the signal candle to close.
Why does the strategy give so many false signals?
Because a crossover only works well when price is actually trending. In a flat, ranging market the two lines sit on top of each other and cross back and forth, producing whipsaws. Skipping trades when the EMAs are tangled is the single biggest thing you can do to cut those false signals.
What settings and expiry should I start with?
Begin with the 10 and 40 EMA pair on a one-minute chart traded with a two-minute expiry, on a demo account. Adjust only after you have logged enough trades to see how it behaves. Every indicator mentioned here is included in the single $39 lifetime plan on the pricing page.
This content is for educational purposes only. Trading involves risk. Past results do not guarantee future outcomes. Always practice responsible money management and limit your daily trades to avoid large losses.


