The headline calls this a "high-probability" method, so let us be honest about that phrase before anything else: no chart setup has a fixed or knowable probability of winning. "High probability" is a hopeful label, not a measured statistic - the market does not owe any pattern a success rate. What the Vortex Indicator and RSI combination actually gives you is a structured way to read trend direction and momentum on Pocket Option, so you can wait for the cleaner moments and skip the messy ones. Treat every signal as something to confirm, never as a promise.
What the Vortex Indicator Plots
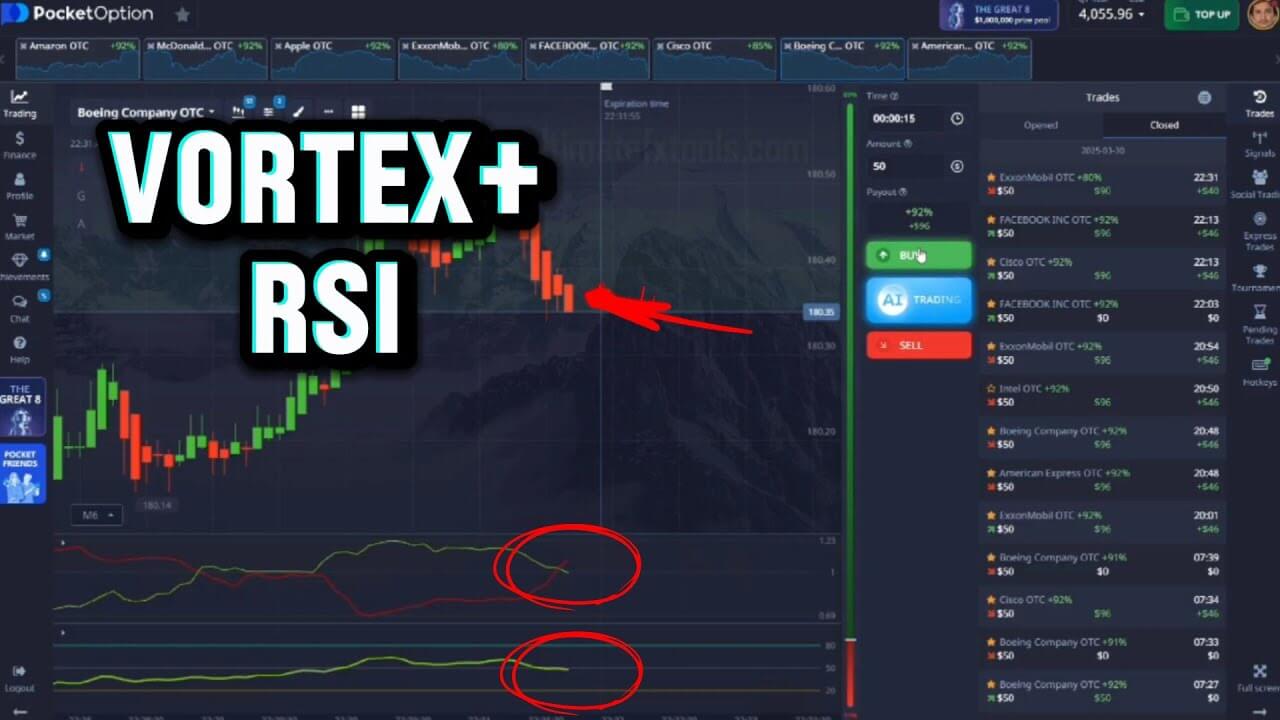
The Vortex Indicator draws two lines, VI+ (usually green) and VI- (usually red), from a default period of 14. VI+ measures upward price movement and VI- measures downward movement. When VI+ crosses above VI-, buyers are gaining the upper hand; when VI- crosses above VI+, sellers are. The crossing of the two lines is the direction cue this method is built around. Like every trend tool, it is lagging by design - it confirms a move that has already begun, and in a flat, ranging market the two lines braid together and cross repeatedly, producing whipsaw signals that go nowhere.
What RSI Adds
The Relative Strength Index (RSI), default period 14 with reference levels at 30 and 70, measures momentum on a 0-100 scale. Readings near 70 suggest an advance may be stretched; readings near 30 suggest a decline may be. In this method RSI is the timing and confirmation layer, not the trigger: it tells you whether momentum agrees with the direction the Vortex lines are pointing. RSI is also an oscillator, so it too whipsaws in choppy conditions and can sit "overbought" or "oversold" for a long stretch during a strong trend without reversing.
How the Two Work Together
The idea is simple: use the Vortex for direction and RSI for timing, and act only when they agree. A Vortex bullish cross while RSI is rising through its midline (around 50) and holding above 30 lines up as an up setup; a Vortex bearish cross while RSI is falling through the midline and below 70 lines up as a down setup. Crucially, confirm on the candle close - an intrabar cross can un-cross before the candle finishes. When the two indicators disagree, the honest move is to stand aside and wait rather than force a trade. For a related take on pairing these tools on this platform, see the Pocket Option Vortex strategy and this RSI and Bulls Power setup.
Setup and Settings
- Vortex Indicator: default period 14, VI+ and VI- lines.
- RSI: default period 14, levels marked at 30 and 70, midline at 50.
- Chart / expiry: the original version of this method used fast 5-second Heikin Ashi candles with a 15-second purchase time. That is very short-term and noisy - a 1-minute chart with a matched expiry gives cleaner reads while you learn the rules.
- Pairs: stick to one or two liquid pairs you know rather than hopping across the whole list.
Entry Rules
- Up: VI+ crosses above VI-, RSI is rising and above its midline, and the signal candle has closed.
- Down: VI- crosses above VI+, RSI is falling and below its midline, and the signal candle has closed.
- Stand aside: the two disagree, price is stuck in a tight range, or RSI is pinned at an extreme with no momentum shift.
When This Method Fails
Both tools are lagging and both whipsaw in a range, so their worst environment is a quiet, sideways market - exactly when the Vortex lines cross most often and RSI drifts around its midline. Losing trades are a normal, unavoidable part of trading; no combination of indicators removes them. Risk control is what keeps you in the game: stake a small fixed fraction per trade, cap how many trades you take in a session, and stop at a preset daily loss limit. Practice on a demo account until the reads feel automatic before risking real funds.
FAQ
Is the Vortex + RSI method really high probability?
No setup has a fixed probability of winning, so treat "high probability" as marketing language rather than a measured fact. What the method gives you is a repeatable way to filter for cleaner setups and skip the ambiguous ones. That discipline is where any edge comes from - not from the label.
What settings should I use?
Keep both indicators on their defaults to start: Vortex period 14 and RSI period 14 with 30/70 levels. The original method used 5-second Heikin Ashi candles with a 15-second expiry, but a 1-minute chart is easier to read while you learn. Adjust only after you have logged enough trades to know why.
Where do I get the indicators?
The Vortex and RSI are standard built-ins on most charting platforms, so you can run this method for free. If you want the wider toolkit used across this site, every indicator is included in a single $39 lifetime plan.
This content is for educational purposes only. Trading involves risk. Past results do not guarantee future outcomes. Always practice responsible money management and limit your daily trades to avoid large losses.