3 EMA Line Short-Term Strategy
The 3 EMA line method stacks three Exponential Moving Averages of different lengths on one chart and reads them as a group. Traders reach for it on fast charts because an EMA weights recent prices more heavily than a simple average, so the lines turn quickly when momentum shifts. That responsiveness is the appeal on a 10-second candle system. It is also the catch: the faster a moving average reacts, the more often it reacts to noise. This page covers the setup, the entry logic, and the conditions where the method breaks down.
What the Three EMAs Actually Show
Think of the three lines as a ribbon. The fast EMA hugs price, the medium EMA trails behind, and the slow EMA moves the slowest. When a genuine trend is underway the ribbon fans out and all three lines slope the same way, stacked in order: in an uptrend the fast line sits on top, the medium in the middle, the slow underneath, with price above all three. A downtrend is the mirror image. That ordered, fanned-out shape is the signal this strategy is built around, because it means short-term, medium-term, and longer-term momentum are pointing the same way at once.
The honest limitation is that every EMA is a lagging, backward-looking calculation. The ribbon confirms a move that has already started rather than predicting the next one. When price drifts sideways, the three lines coil together and print crossover after crossover that leads nowhere. Recognising a tangled ribbon and standing aside matters as much as spotting a clean one.
Setting Up the 3 EMA Line Strategy
Adjust the timeframe to your own comfort and experience rather than treating these numbers as fixed rules.
- Timeframe: a 10-second per candlestick chart for the quickest reading; a slower candle gives you more time to think and filters out some noise.
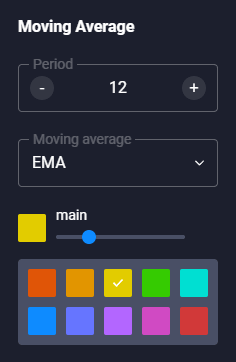
- Fast EMA: 5-period — tracks the newest price swings.
- Medium EMA: 10-period — the middle reference that smooths the fast line.
- Slow EMA: 20-period — the slowest line, used to judge the wider direction.
- Platform: apply all three EMAs to the price chart on the Quotex Mobile platform, or any charting tool that overlays multiple moving averages.
How to Read an Entry
The plan is deliberately simple so it can be applied calmly under a short timer:
- Wait for alignment. A possible up move is in play when the fast EMA crosses above the medium and slow lines and all three fan out sloping upward. A possible down move is the reverse, with the fast line crossing below and the ribbon fanning downward.
- Confirm with price action. A crossover alone is weak. Look for a candle closing strongly in the direction of the ribbon as price pushes away from the lines.
- Stand aside when the ribbon tangles. If the three EMAs are flat, braided together, or the fast line keeps flicking across the others, the market is ranging and the crossovers are false signals. No entry is a valid decision.
Where This Method Fails
Because EMAs lag, the ribbon is at its worst in the conditions short-term charts produce most often: quiet, choppy, range-bound periods. There the fast line crosses the slow line repeatedly, and each cross tempts an entry right before price reverses. It also lags at sharp turns, giving its clearest signal only after much of the move has happened. Treat the ribbon as one input, not a complete system. Pairing it with a separate momentum or overbought/oversold tool, and skipping trades during sideways drift, does more for consistency than chasing every crossover. For a version that adds a filter on top of the lines, see the Pocket Option 3 EMA lines with RSI setup.
Related EMA Approaches
To compare methods, the 3 EMA strategy for 5-second trading applies the same idea on an even faster chart, the Quotex 2 EMA strategy strips it back to a simpler two-line cross, and the Rainbow EMA extends the concept into a multi-line ribbon for reading trend strength.
FAQ
Why do the three EMAs give so many false signals?
Because moving averages lag price and only react after a move begins. In a ranging or choppy market the lines cluster together and cross back and forth, producing crossovers that fade almost immediately. Trade the ribbon only when it is clearly fanned out and sloping one way, and sit out when it is tangled.
What are the best EMA settings for short-term trading?
This page uses a 5, 10 and 20 combination on a 10-second candle, which keeps the lines responsive without reacting to every tick. There is no single correct set; faster settings react sooner but produce more noise. Test any settings on a demo account first. The full indicator library, including EMA-based tools, is covered by the one-time plan on our pricing page.
Is the 3 EMA method enough on its own?
No. On its own it tends to over-signal in flat markets. It works best as one confirmation among several, combined with price action and a momentum filter, and paired with strict risk control: a small, fixed stake per trade, a cap on trades per session, and a daily loss limit you stick to.
This content is for educational purposes only. Trading involves risk. Past results do not guarantee future outcomes. Always practice responsible money management and limit your daily trades to avoid large losses.


