5 Olymp Trade Reversal Strategy
Reversal trading is one of the most popular approaches for fixed-time trades on Olymp Trade. Instead of riding an established trend, you look for the moment price runs out of momentum and turns back the other way. On short expiries like 1 minute or Quickler 5 seconds, these turning points happen constantly — especially when the market is moving sideways in a range rather than trending.
The challenge is telling a genuine reversal apart from a brief pause in a trend. That is where oscillators and volatility tools earn their place: they highlight when price is stretched too far, too fast, and likely to snap back. Here are five reversal approaches covered in detail on this site — none removes risk, but each gives you a structured way to decide when a turn is more likely than a continuation.
1. RSI Overbought and Oversold Turns
The Relative Strength Index is the classic reversal filter: above 70 the move is stretched, below 30 sellers are exhausted. The cleanest entries come when RSI leaves the extreme zone and crosses back toward the middle, rather than the moment it first touches 70 or 30. Pairing RSI with a second confirmation tool cuts down on premature entries — we walk through one such combination in our Olymp Trade Quickler trading with Aroon and RSI guide.
2. Bollinger Bands Snap-Backs
Bollinger Bands wrap price in a volatility envelope, and in a ranging market price tends to rotate from one band to the other. A candle that pierces the upper or lower band and then closes back inside it is a common reversal cue — the push beyond normal volatility failed — with the middle band as a realistic target. For a full setup that adds a second tool to time the entry, see the Quickler strategy with Bollinger Bands and ZigZag.
3. Aroon Crossovers
The Aroon indicator measures how long it has been since the most recent high and low, which makes it useful for spotting when a trend is aging and ready to flip. When Aroon Up crosses below Aroon Down after an extended climb (or the reverse after a decline), the old move is losing its grip. Aroon works best combined with a moving average or price filter so you are not reacting to every minor wiggle — our post on trading Olymp Trade with Aroon and EMA shows one practical pairing on the 1-minute chart.
4. Stochastic Oscillator Reversals
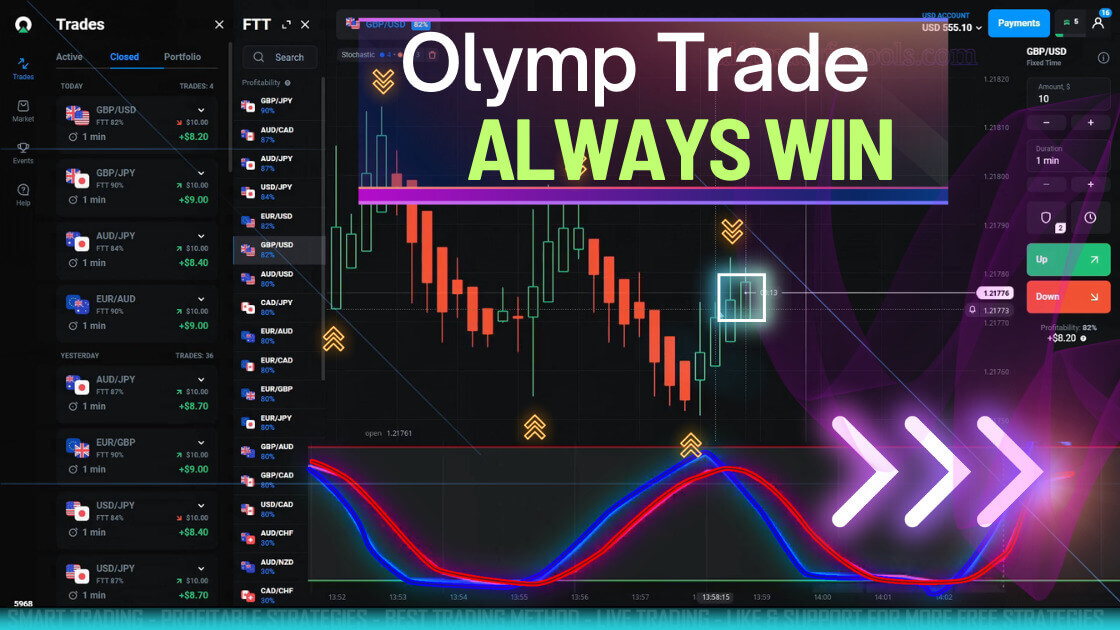
The Stochastic oscillator compares the closing price to its recent range, so it reacts quickly when momentum stalls — a useful trait on very short expiries. Look for the %K line to cross %D inside the overbought zone (above 80) for a downward turn, or inside the oversold zone (below 20) for an upward one. Because Stochastic fires more signals than RSI, you need to be more selective about market conditions — we cover a short-expiry application in the Olymp Trade Quickler Stochastic post.
5. Parabolic SAR Flips
Parabolic SAR plots dots above or below price, and the moment those dots flip sides is a built-in reversal alert — one of the simplest tools to read at a glance, which makes it popular on mobile. The trade-off is that SAR flips frequently in choppy conditions, so it should confirm what price action is already suggesting rather than act as a standalone trigger. Our guide to Olymp Trade 1-minute reversals with Parabolic SAR explains the settings and entry rules in detail.
Reading Reversal Conditions
All five approaches share one requirement: the market should be in a condition where reversals are likely. First, confirm price is moving sideways — bouncing between visible support and resistance with no strong slope. Reversal signals fired against a powerful trend fail far more often than they succeed.
Second, act only on closed candles. Oscillators repaint their value as the live candle moves, so a "signal" that appears mid-candle can vanish by the close.
Third, avoid scheduled news releases. A rate decision or employment report can drive price straight through every overbought or oversold reading, and short fixed-time trades leave no room to recover — check an economic calendar and sit out the minutes around major events.
FAQ
How do I know the market is ranging?
Zoom out a few dozen candles: if recent highs and lows sit at roughly similar levels and price keeps returning to a horizontal midpoint, you are in a range. A flat 50-period EMA that price crosses repeatedly is another quick check; clear higher highs or lower lows mean the market is trending, so skip reversal setups there.
Which timeframe works best for reversal trades?
Most traders use the 1-minute chart with 1–3 minute expiries, since ranges form and resolve quickly there. Quickler 5-second trades are possible but far less forgiving — noise is heavier and signals must be taken instantly. If you are still learning, practice on a demo account before shortening the expiry.
Do I need paid indicators for these strategies?
No — RSI, Bollinger Bands, Aroon, Stochastic, and Parabolic SAR are all built into Olymp Trade and MetaTrader for free, and every strategy above works with the standard versions. Custom tools with alerts and combined signals can save chart-watching time — that is what our $39 lifetime package bundles together — but the free built-ins are a good place to start.
This content is for educational purposes only. Trading involves risk. Past results do not guarantee future outcomes. Always practice responsible money management and limit your daily trades to avoid large losses.