5-Second Quickler on Olymp Trade: Bollinger Bands & EMA
A 5-second Quickler trade on Olymp Trade closes almost as soon as it opens, and that single fact should shape every expectation you bring to this page. At a five-second expiry the result is dominated by random, tick-level noise: spread, execution latency and the next one or two price prints matter far more than any chart pattern. No indicator — Bollinger Bands, EMA or otherwise — can reliably predict where price will be five seconds from now.
Treat what follows as a rules-based framework, not a signal service. It helps you stay disciplined on a chaotic timeframe, but structure is not the same as an edge, and it does not remove losing trades.
What Bollinger Bands Actually Show
Bollinger Bands plot a moving average in the middle with an upper and lower band set a number of standard deviations away. Those bands measure volatility and nothing else — they widen when price moves quickly and contract when it settles. A common mistake is to treat a band touch as a buy or sell signal. It is not. In a genuine trend, price can ride the upper or lower band for many candles in a row, so fading every touch trades straight against momentum. A band tag only tells you price has stretched relative to recent volatility.
What the EMA Adds
The exponential moving average reacts faster to recent prices than a simple average, which is why it is used here for trend direction. When the EMA sits above the Bollinger middle line the short-term bias is up; below it, the bias is down. The EMA summarises what price has just done — it does not forecast the next tick.
Recommended Settings
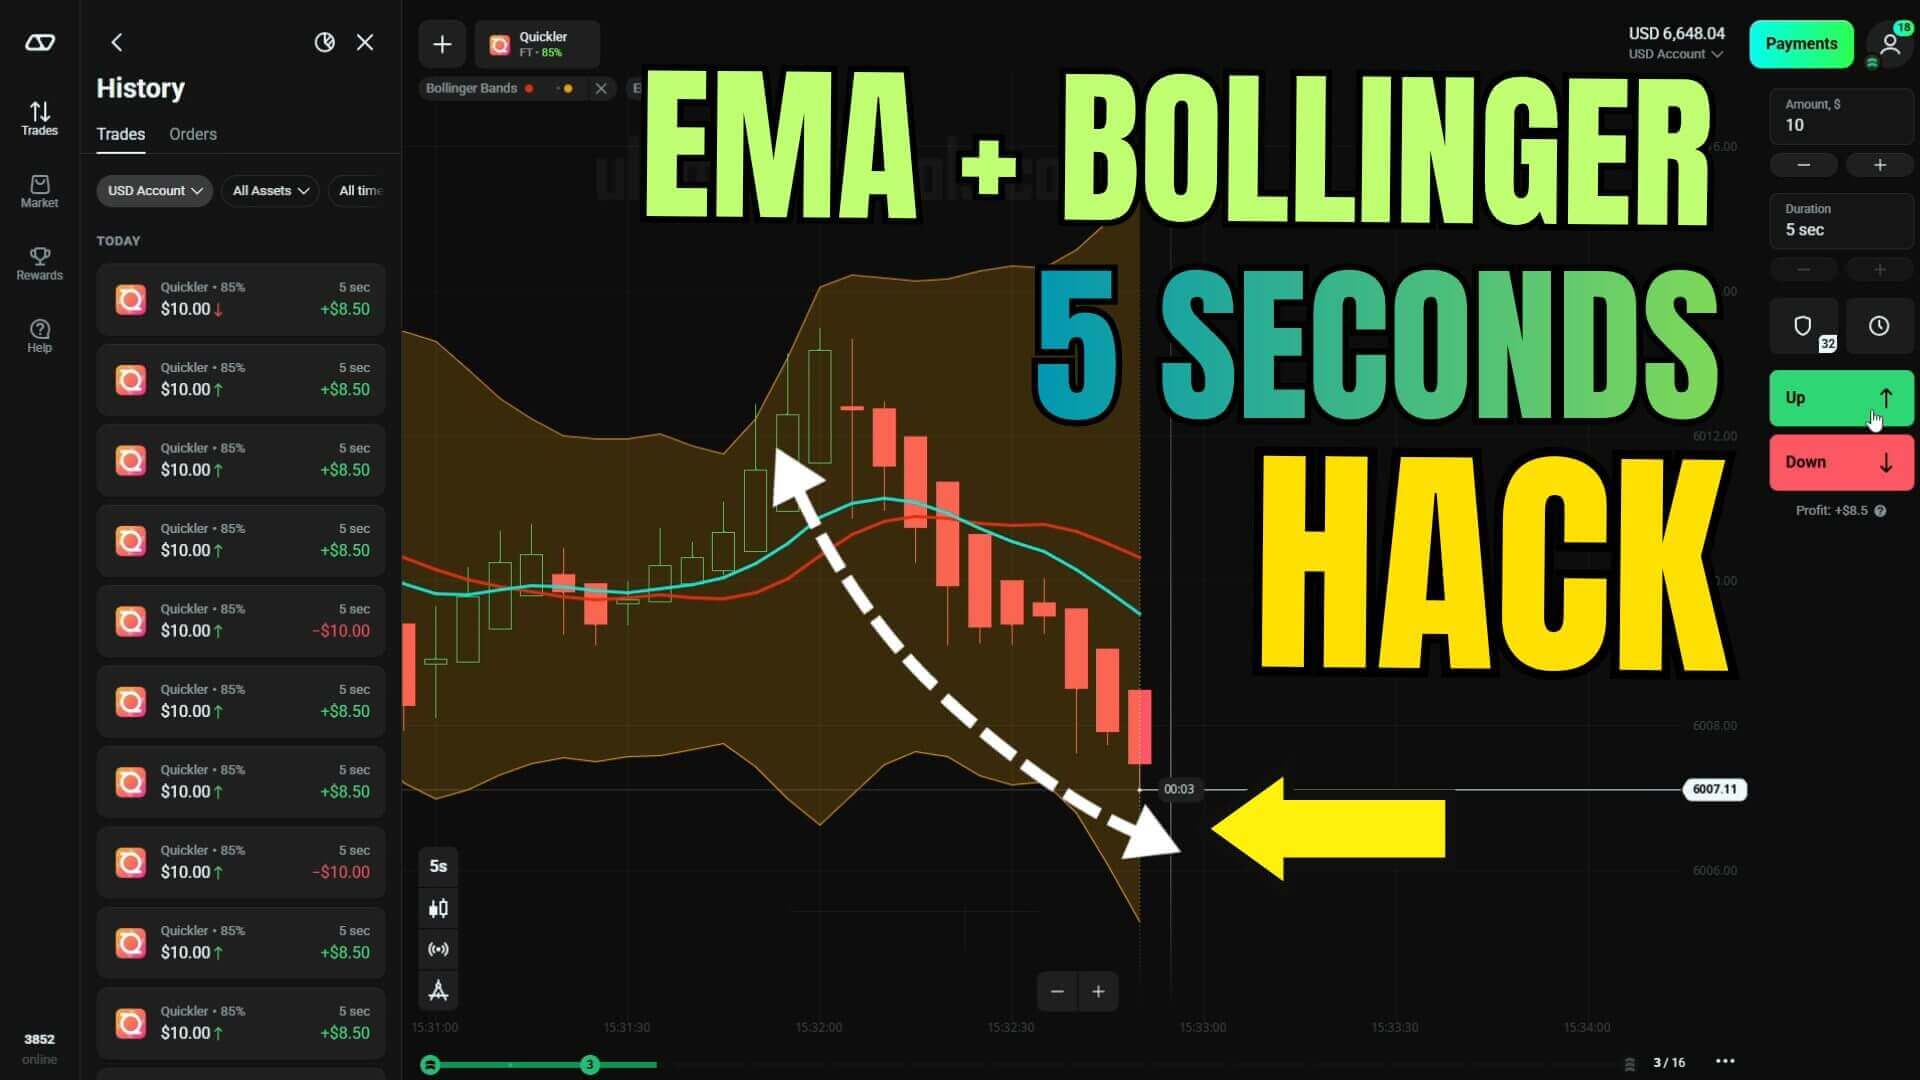
- Bollinger Bands: Period 14, Deviation 3. The middle line (often red) acts as your moving-average reference.
- EMA: Period 14. Colour it blue or green so it stands out clearly against the bands.
- Chart: 5-second candles, on a pair you know well.
Entry Rules
The rules are deliberately simple so they can be applied without hesitation inside a five-second window:
- Call (up): the EMA is above the Bollinger middle line, price has dipped toward the lower band, and two or three candles then close back in the trend's direction before you enter.
- Put (down): the EMA is below the middle line, price has stretched toward the upper band, and momentum turns back down.
- Stand aside: the EMA and price are tangled around the middle line with no clear bias, or price is riding a band inside a strong trend.
Why the 5-Second Expiry Is the Most Dangerous Timeframe
Of every expiry Olymp Trade offers, five seconds is the least forgiving. The shorter the window, the closer the result moves toward a coin flip, because ordinary random fluctuation swamps whatever small directional signal the indicators produce. Spread and execution latency are fixed costs that eat a larger share of a tiny move, and two identical setups can resolve in opposite directions on which tick lands first. That is why the timeframe carries extremely high variance: even a disciplined process will string together losses that a one-minute chart would smooth out.
When This Setup Fails
The method breaks down fastest in strong trends, where price hugs a band and every reversion entry loses, and in dead, low-volatility patches where 5-second candles become pure noise. News spikes and thin OTC liquidity make it worse. Since no reading is reliable at this speed, risk control is the only part you fully own: stake a small, fixed fraction of your balance, cap the trades you take per session, set a daily loss limit and stop when you hit it. Demo the rules first, and treat a losing run as a normal feature of this expiry. Chasing losses with bigger stakes is the fastest way to empty an account.
For the same tools at slightly more forgiving speeds, see the Olymp Trade Quickler 5 Second Strategy and how the bands pair with a filter in the Quickler Bollinger Bands and ZigZag guide. For what the bands do and do not measure, read the Expert Option Bollinger strategy and 5 uses of Bollinger Bands in trading.
Unlock the Strategy

 Unlock Indicator Settings
FAQ
Is the 5-second Bollinger and EMA strategy reliable?
No method is reliable at a 5-second expiry. Bollinger Bands and the EMA can organise your decisions, but they cannot predict a five-second move, and the outcome is driven largely by short-term noise, spread and latency. Expect losing trades as a normal part of this timeframe.
What are the exact settings?
Bollinger Bands at Period 14 and Deviation 3, an EMA at Period 14, and a 5-second candle chart. Colour the EMA distinctly from the bands so the middle line stays readable. The full indicator files and step-by-step setup are part of the $39 lifetime plan.
Is a longer expiry safer than 5 seconds?
Generally, yes. A one-minute or longer expiry gives price room to follow through and reduces the share of the result decided by a single tick. The same Bollinger and EMA logic applies, but the extra time smooths out some of the variance that makes 5-second trading so punishing.
This content is for educational purposes only. Trading involves risk. Past results do not guarantee future outcomes. Always practice responsible money management and limit your daily trades to avoid large losses.