Trading Expert Option With Bollinger Bands
Bollinger Bands are one of the most recognised tools on Expert Option, and also one of the most misread. The indicator draws three lines around price: a middle moving average and an upper and lower band set a fixed distance above and below it. That distance is based on volatility, so the envelope breathes with the market. Used with a clear plan the bands help you judge whether price is stretched or resting; used as a simple "touch equals reverse" trigger, they will hand you a string of losing trades in exactly the conditions where they look most tempting.
What Bollinger Bands Actually Plot
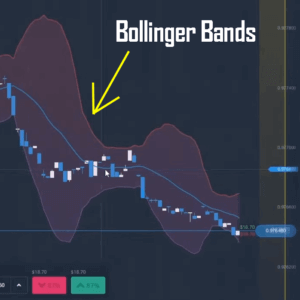
The middle line is a simple moving average, by default over 20 periods. The outer bands sit two standard deviations away from that average. Standard deviation is a measure of how spread out recent prices are, so when the market is active the bands widen and when it goes quiet they pull in tight. That is the single most important idea to hold on to: the bands describe volatility, not direction. A band does not "push" price back, and touching one is not a signal on its own. For a broader look at how the tool is applied, see 5 uses of Bollinger Bands in trading.
The Squeeze and the Ride
When the two bands contract into a narrow channel, the market is calm and coiling. This squeeze often comes before a sharper move, though it never tells you which way that move will go, so many traders wait for price to break out of the channel and then trade in the direction of the break with a second tool confirming it. The opposite situation is the classic beginner trap. In a strong trend price will hug the upper or lower band candle after candle, "riding the band" higher or lower. A trader who keeps betting on a reversal every time price kisses the band is fighting the trend and losing on each attempt. A band touch inside a trend is continuation, not exhaustion.
Where the Bands Mislead You
Bollinger Bands are at their most reliable when the market is ranging sideways, where a move to the outer band and back toward the middle is a genuine mean-reversion setup. They are at their weakest in trending markets, which is unfortunately when a naked band touch looks like the most obvious trade. This is why confirmation matters. Pairing the bands with a momentum reading such as RSI, or with the trend-aware Bollinger MA indicator, filters out most of the touches that would otherwise trap you into trading against a running trend.
Recommended Settings
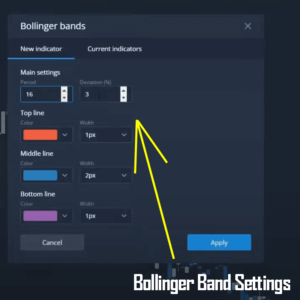
Start with the standard configuration: a 20-period middle average and bands set at 2 standard deviations. These defaults suit most Expert Option pairs and are the values almost every chart study assumes. Some traders tighten the reading to a shorter 16-period average with a wider 3-deviation band to make the envelope react faster on very short expiries, so treat those numbers as a variation to test on a demo account rather than a fixed rule. Keep the chart uncluttered, trade a small set of liquid pairs such as EUR/USD, GBP/USD or USD/JPY, and let each candle fully close before you read the bands.
Entry Rules on Expert Option
- Range buy (up): price is inside a sideways range, tags the lower band and turns back up, with RSI lifting out of oversold. Look for the candle to close back inside the bands before you commit.
- Range sell (down): price tags the upper band inside the same flat range and rolls over, with RSI easing down from overbought.
- Squeeze breakout: the bands have pinched tight, price breaks clear of the channel, and a momentum tool agrees with the direction of the break.
- Stand aside: price is riding one band in a clear trend, or the bands are wide and price is mid-channel with no edge. When in doubt, no trade is a position.
FAQ
Is a Bollinger Band touch a buy or sell signal by itself?
No. A touch only tells you price has reached the edge of its recent volatility range. In a range it can mark a turning point, but in a trend price will ride the band and keep going. Always confirm with the trend context and a second indicator before acting.
What settings should I use, and do I need to pay for anything?
The default 20-period, 2-deviation setup is a sound starting point and the standard Bollinger Bands tool is free on Expert Option and in MetaTrader. If you later want confirmation indicators and chart tools bundled together, every indicator on this site is included in a single $39 lifetime plan, but you can trade this method with the built-in bands alone.
Do Bollinger Bands work better on trends or ranges?
For mean-reversion entries they are strongest in ranging markets. In trends they are best used to confirm continuation or to trade squeeze breakouts, not to pick tops and bottoms. For a scanner-based take on the same idea, see Expert Option with the Bollinger Bands AI chart scanner.
This content is for educational purposes only. Trading involves risk. Past results do not guarantee future outcomes. Always practice responsible money management and limit your daily trades to avoid large losses.