5 Uses of Bollinger Bands in Trading
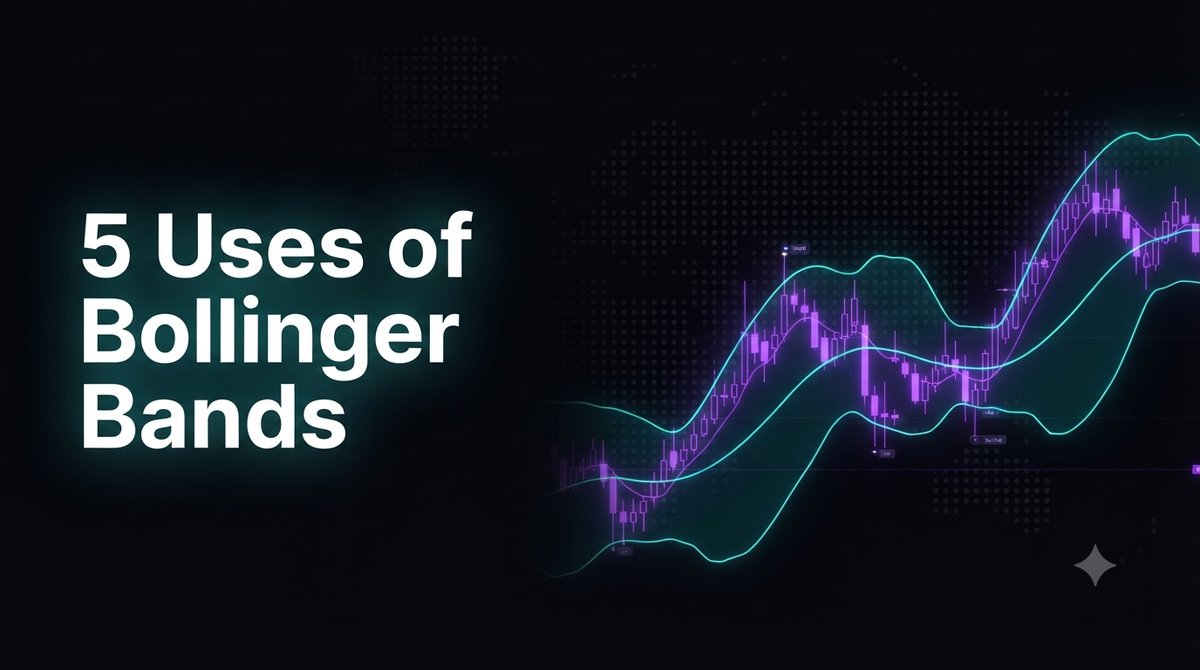
Bollinger Bands are one of the most widely used volatility tools in technical analysis, built by John Bollinger in the 1980s. The indicator plots three lines: a middle band that is a 20-period simple moving average (SMA), plus an upper and a lower band set two standard deviations away from that average. Because standard deviation expands when price swings widen and contracts when the market goes quiet, the bands breathe with volatility and give you a live read on how stretched or calm price has become.
That responsiveness is why the tool is so popular with both forex and fixed-time or binary traders: on a forex chart the bands frame trend strength and pullback zones, while on short-expiry platforms they help you time entries against volatility extremes in seconds. Below are five practical ways to read them.
1. Spotting Overbought and Oversold Band Touches
When price stretches up to touch or pierce the upper band, it has traveled roughly two standard deviations above its average, a sign the market may be temporarily overbought; a touch of the lower band signals the opposite oversold condition. These touches are not automatic reversal signals, but they flag zones where a bounce or pause becomes more likely. Many traders wait for a candle to close back inside the band before acting, which filters out weak signals during strong moves.
2. The Squeeze: Low Volatility Before a Breakout
A "squeeze" happens when the upper and lower bands pull in close together, showing that volatility has dropped and price is coiling in a tight range. Quiet markets rarely stay quiet, so a narrow squeeze often precedes a sharp expansion once buyers or sellers finally take control. Traders watch for the first strong candle that pushes out of the compressed range as an early breakout cue, and add a volume or momentum check to confirm the move rather than chasing a false start.
3. The Band-Walk: Reading a Strong Trend
In a powerful trend, price does not just touch a band and reverse; it hugs and "walks" along the upper band in an uptrend or the lower band in a downtrend. This band-walk tells you momentum is firmly one-sided, and it traps traders who assume every band touch means reversal. The smarter read is to treat pullbacks toward the middle band as continuation opportunities rather than fighting a trend that still has fuel.
4. Mean-Reversion Re-Entry Signals
In ranging or sideways conditions, price tends to oscillate between the two bands and revert toward the middle 20-period average. This lets you plan mean-reversion entries: buy near the lower band aiming toward the middle line, or sell near the upper band back toward the center, using the middle band as a natural target and re-entry level. This use works best in balanced markets and should be avoided during an active band-walk.
5. Dynamic Support and Resistance
Because the bands recalculate on every new candle, they form moving, adaptive support and resistance rather than the fixed horizontal lines most traders draw. In an uptrend the lower and middle bands frequently catch pullbacks and act as dynamic support, while in a downtrend the upper and middle bands cap rallies as dynamic resistance. Watching how price reacts at these shifting levels helps you gauge whether a trend is healthy, and pairing them with a classic horizontal level produces a stronger zone.
Bollinger Band Settings and Tips
The default settings, a 20-period length with a 2.0 standard-deviation multiplier, remain the best starting point for most instruments and timeframes. On a very volatile pair or a fast expiry you can widen the deviation to 2.5 to reduce noise, but test any change before relying on it. Because the bands describe volatility but not direction, combine them with a momentum tool such as RSI to avoid false signals, for example only taking a lower-band buy when RSI also shows oversold conditions. Finally, confirm on the candle close rather than reacting mid-candle, since intrabar spikes often retreat back inside the bands and bait you into weak entries.
If you want ready-made Bollinger tools, our Bollinger MA indicator blends a moving average with the bands to highlight trend reversals, and you can study a full setup in our guide to Bollinger Bands and candle bars or the platform-specific Expert Option Bollinger strategy. All of these tools, plus 100+ indicators and strategies for MT4 and MT5, are included in the $39 lifetime access package, so you get every download with a single one-time payment.
FAQ
What are the best Bollinger Band settings for beginners?
Stick with the defaults: a 20-period simple moving average and a 2.0 standard-deviation multiplier. These values are what John Bollinger originally recommended and they behave predictably across forex and fixed-time charts. Once you are comfortable reading squeezes and band touches, you can experiment with the deviation on more volatile markets.
Which indicator works best with Bollinger Bands?
RSI is the most common partner, because it adds momentum context that the bands alone do not provide and helps filter out false band touches. Some traders also pair the bands with a moving-average crossover or trend filter, the goal being confirmation from two different angles rather than a single signal.
Do Bollinger Bands work on all platforms?
Yes. Bollinger Bands are a standard built-in indicator on MT4, MT5, and virtually every charting or fixed-time platform, and the same reading principles apply everywhere. The bands measure volatility from price data, so they behave consistently whether you trade forex majors or short-expiry contracts, provided the period and deviation are set the same way across platforms.
This content is for educational purposes only. Trading involves risk. Past results do not guarantee future outcomes. Always practice responsible money management and limit your daily trades to avoid large losses.