6 Best Indicators for Binary Options
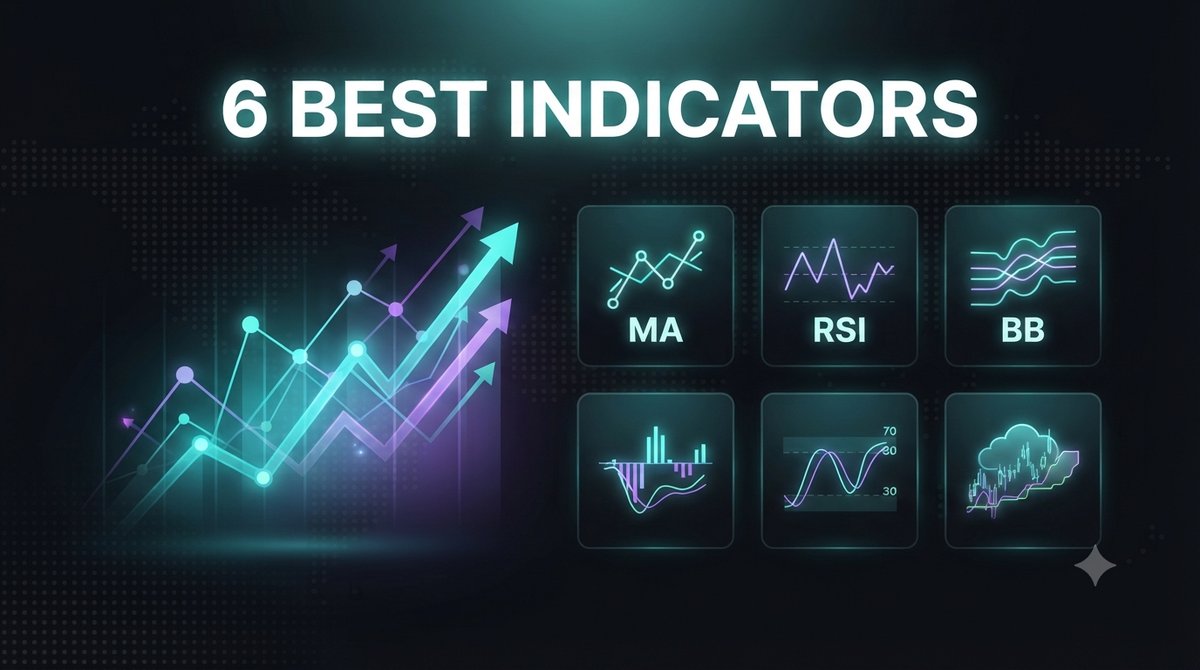
Indicators are tools that turn raw price data into a readable signal. None of them predict the future, and every one of them can be wrong. What a good indicator does is describe what the market is doing right now — its momentum, its volatility, or its trend — so you can make a more informed decision. Below are six widely used indicators for short-term and binary options trading. Each has a clear job, and each has a real weakness you need to respect.
1. Relative Strength Index (RSI)
RSI is a momentum oscillator that moves between 0 and 100, flagging when a market looks stretched (commonly above 70) or oversold (below 30). It is useful for spotting when a move may be losing steam. Its weakness: in a strong trend, RSI can stay "overbought" for a long time, so acting on the reading alone often means fading a move too early. For a signalled version, see our RSI Alert Indicator.
2. MACD
The Moving Average Convergence Divergence tracks the relationship between two moving averages to show momentum shifts, usually through a signal-line crossover or histogram change. It helps confirm the direction of a move. Its weakness is lag: because it is built from moving averages, MACD reacts after price has already turned, which makes it less reliable in choppy, sideways markets. Our MACD with alerts post walks through a practical setup.
3. Bollinger Bands
Bollinger Bands wrap price in a band that widens and narrows with volatility. When bands squeeze, volatility is low; when they expand, a bigger move may be underway. The common weakness is misreading a "touch" of the outer band as an automatic reversal — in a trend, price can ride a band for many candles. Pairing bands with a moving average, as in our Bollinger MA indicator, gives more context.
4. Moving Averages (EMA/SMA)
A moving average smooths price into a single trend line, and crossovers between a fast and a slow average are a classic way to read direction. Their strength is clarity; their weakness is that they lag and produce false crossovers when the market is ranging, generating whipsaw signals that cost you.
5. Stochastic Oscillator
The Stochastic compares the closing price to a recent high-low range to gauge momentum and overbought or oversold conditions. It reacts quickly, which is helpful on short timeframes, but that same sensitivity produces frequent false signals in fast or noisy conditions.
6. DeMarker
The DeMarker indicator measures demand for an asset by comparing recent highs and lows, helping identify potential exhaustion points. Like other oscillators, it can signal a reversal that never arrives during a strong directional move, so treat its readings as context rather than a trigger.
How to Combine Them Sensibly
More indicators are not automatically better. Stacking several tools that measure the same thing — for example RSI, Stochastic, and DeMarker are all momentum oscillators — is correlation, not confirmation; they will often agree simply because they read the same input. Genuine confirmation comes from combining different types: a trend tool (moving average), a momentum tool (RSI), and a volatility tool (Bollinger Bands). Even then, expect conflicting signals and false readings. When indicators disagree, the honest response is to stay out of the trade.
Risk Management
No indicator removes risk, so position sizing does the heavy lifting. A common guideline is to risk only a small, fixed percentage of your account — many traders cap it at 1-2% per trade — so a losing streak does not end your account. Avoid the Martingale approach of doubling after losses: it can escalate a bad run into a catastrophic loss very quickly, and it does not improve the odds of any single trade. A fixed-stake plan is far safer and easier to review.
Frequently Asked Questions
Will these indicators guarantee winning trades?
No. No indicator or combination of indicators can guarantee a winning trade or a specific result. Indicators describe past and current price behaviour; they do not predict the future. Markets can move against any signal, and you can lose money.
Which single indicator is best for beginners?
There is no single "best" one — it depends on your style. Beginners often start with RSI or a moving average because they are easy to read, then add one complementary tool once the basics feel comfortable. Practise on a demo account first.
Do I need to pay for these indicators?
Most of these are built into standard trading platforms and charting tools at no cost. If you want ready-made, pre-configured versions with alerts plus setup guides, our full library is available for a one-time $39 lifetime payment, but you can learn and apply every concept above using free tools.
This content is for educational purposes only and is not financial advice. Trading involves substantial risk; you can lose some or all of your capital. No result is guaranteed and past performance does not indicate future results. Trade only what you can afford to lose.