Canvas Trend Line — TradingView Script Indicator
Canvas Trend Line is a Pine Script indicator you add to a TradingView chart to make the prevailing direction easier to read at a glance. Instead of drawing trend lines by hand, it colours the trend from the relationship between two moving averages so an uptrend, a downtrend, and a stalling move each look different. TradingView is a charting tool, so you read the signal there and then place the actual trade on your binary options platform. Understand one thing first: a trend tool describes what price has already been doing — it confirms a move that is underway rather than predicting the next one.
What Canvas Trend Line Plots
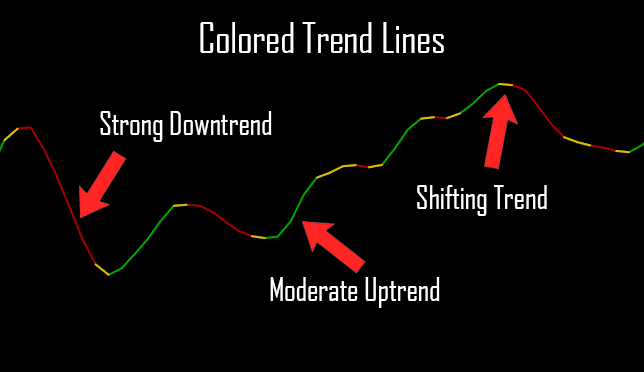
Under the hood the script measures the difference between two weighted moving averages (WMA) and uses that gap to decide which way the market is leaning. It then colour-codes the plot:
- Green (lime): momentum is pointing up — the recent trend is higher.
- Red: momentum is pointing down — the recent trend is lower.
- Yellow: the trend is flattening or reversing. Treat this as a caution state, not a trade signal.
The yellow phase matters most: it is where a trend either resumes or turns, and where an auto-drawn line is most likely to redraw as a new swing forms.
Why a Trend Indicator Lags
Any moving-average-based tool is built from past candles, so it changes colour after a move has started, not before. That lag is the trade-off you accept for filtering out random noise. Auto-drawn trend lines carry a second catch: as new swing highs and lows form, the script can redraw earlier lines, so a line that looked clean an hour ago may sit somewhere else once the chart updates. Treat the current colour as a read on the existing trend, not a locked-in forecast.
How to Add It on TradingView
- Open your chart and click the Pine Editor tab at the bottom of the screen.
- Paste the Canvas Trend Line script into the editor and press Add to chart.
- In the indicator settings, adjust the moving-average lengths — shorter lengths react faster but flip colour more often; longer lengths are steadier but slower.
- Save the layout so the indicator loads automatically next time.

How to Confirm a Signal
A trend colour on its own is a starting point, not a trade. Confirm it before you act:
- Check that price is holding above a recent swing low for an up read, or below recent resistance for a down read.
- Add a second indicator that measures something different — momentum such as MACD or RSI, or volatility — rather than another moving average, so you are not just confirming the same maths twice.
- Wait for the candle to close before you trust the colour; an intrabar colour can flip before the bar finishes forming.
When the trend colour and your confirmation disagree, the honest move is to stand aside. Skipping the unclear setups is what leads to more consistency over time.
When It Fails and How to Manage Risk
Trend tools struggle most in sideways, ranging markets, where the colour flips back and forth and every flip looks like a fresh signal. They also lag hardest at sharp turning points and around major news, when price can gap through a line before the indicator catches up. Use the tool for what it is good at — reading an established trend — and stay out when the chart has no clear direction.
Risk control keeps you in the game regardless of the signal. Stake a small, fixed fraction of your balance per trade, cap how many trades you take in a session, and stop once you hit a preset loss limit. Do not increase your stake to chase back a loss — that habit drains accounts faster than any single bad trade. Practise the whole routine on a demo account before you risk real funds.
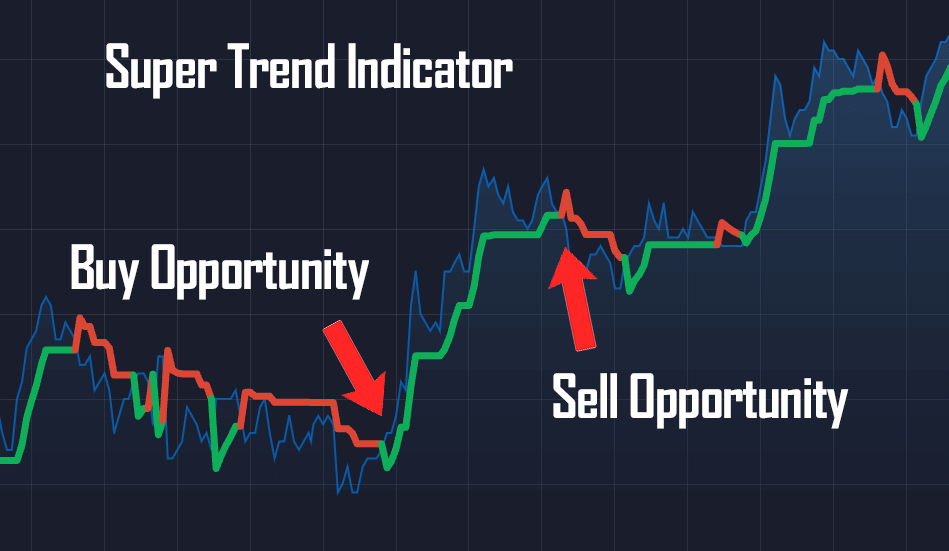
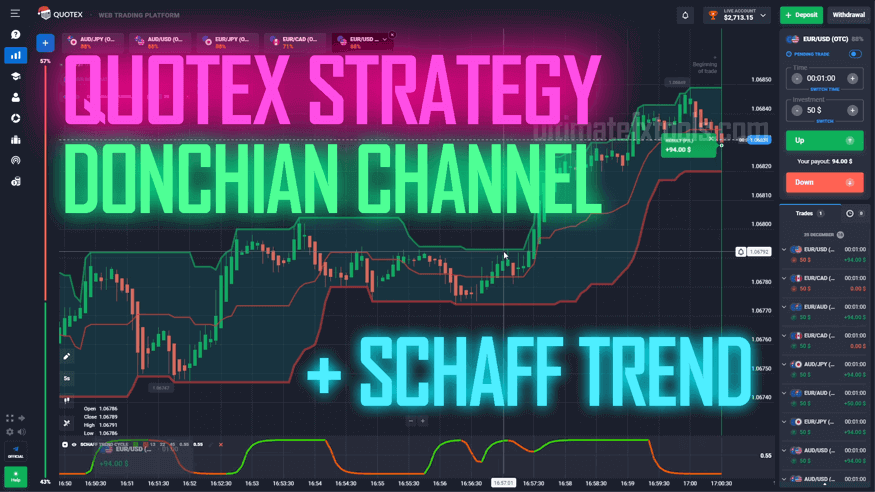
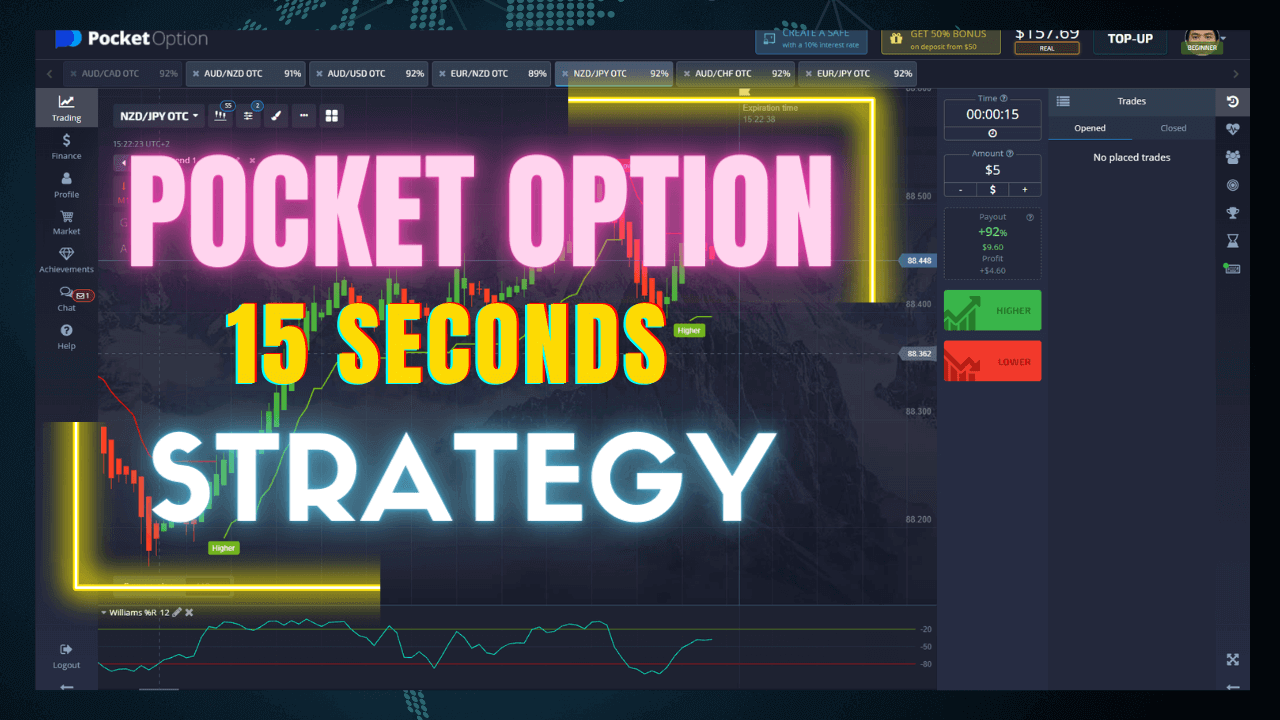
Canvas Trend Line is available to all UltimateFXTools members as part of the lifetime access package, which includes 100+ indicators, strategies, and Pine Scripts for TradingView. It pairs naturally with other trend-based methods on the site, such as the Pocket Option Super Trend strategy, the Quotex Donchian Channel and Schaff Trend Cycle setup, and this fast 15-second Pocket Option strategy.
FAQ
Does Canvas Trend Line repaint?
Because it draws from moving averages of recent price, the colour can change as new candles form, and auto-drawn lines can redraw as fresh swings appear. Always let the current candle close before acting on a colour, and treat the newest line as provisional rather than fixed.
Can I trade straight from the TradingView signal?
No. TradingView is where you read the trend; the trade itself is placed on your binary options platform. Use the indicator to spot direction, confirm it against price structure and a second tool, then act on your platform.
What settings should I use, and where do I get the script?
Start with the default moving-average lengths and only adjust once you have watched how the colour behaves on your pair and timeframe. The full Canvas Trend Line script, along with every other indicator on the site, is included with a single $39 lifetime plan.
This content is for educational purposes only. Trading involves risk. Past results do not guarantee future outcomes. Always practice responsible money management and limit your daily trades to avoid large losses.