IQ Option Rainbow MA and KDJ Trend Strategy
The Rainbow Moving Average strategy on IQ Option combines two very different tools: a spread of moving averages that shows the direction and strength of a trend, and the KDJ oscillator that helps with timing. Before going further it is worth being clear about what these indicators actually do. Neither one predicts the future. A moving average is an average of prices that have already printed, and KDJ is derived from where price has recently closed inside its range. They describe momentum that already exists on the chart, and you use that description to make a more informed decision about the next candle.
What a Rainbow Moving Average Plots
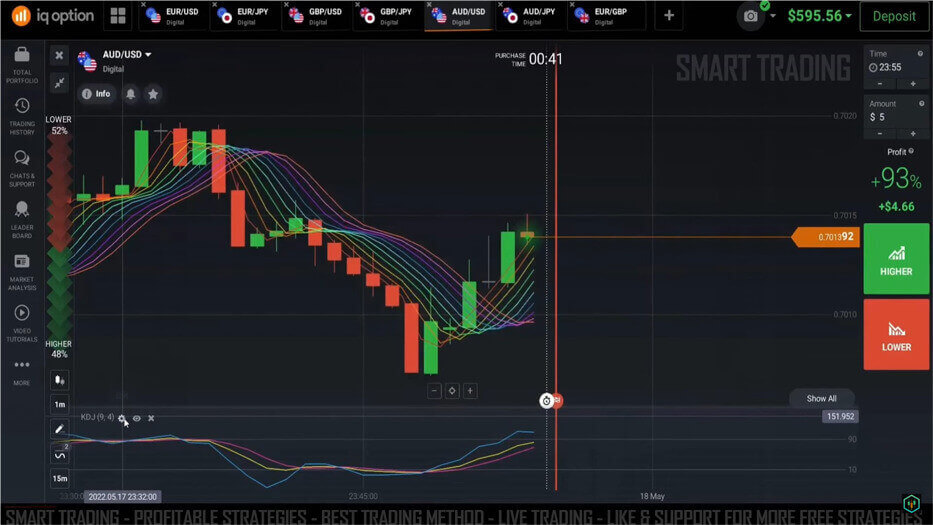
A rainbow is simply several moving averages of increasing length drawn on the same chart at once, so the shortest reacts quickly and the longest reacts slowly. Plotted together they form a band that looks like a rainbow. When the averages fan out and stack in order — short above long for an uptrend, short below long for a downtrend — the layers are telling you the trend is aligned and has momentum behind it. When they tangle together and cross back and forth, the market is ranging, and any signal taken from them is unreliable. The tangle is your cue to stand aside, not to trade harder.
What KDJ Adds
KDJ is a momentum oscillator built from the stochastic formula. It has three lines: K and D behave like a normal stochastic, while the J line is a faster, leading line that extends beyond them and reacts first. Readings above the upper line suggest the recent move is stretched to the upside (overbought), and readings below the lower line suggest it is stretched to the downside (oversold). On its own KDJ whipsaws badly in a strong trend because it can sit pinned at an extreme while price keeps running. That is exactly why it is paired with the rainbow: the rainbow decides direction, and KDJ only helps you time an entry in that direction.
Setup and Recommended Settings
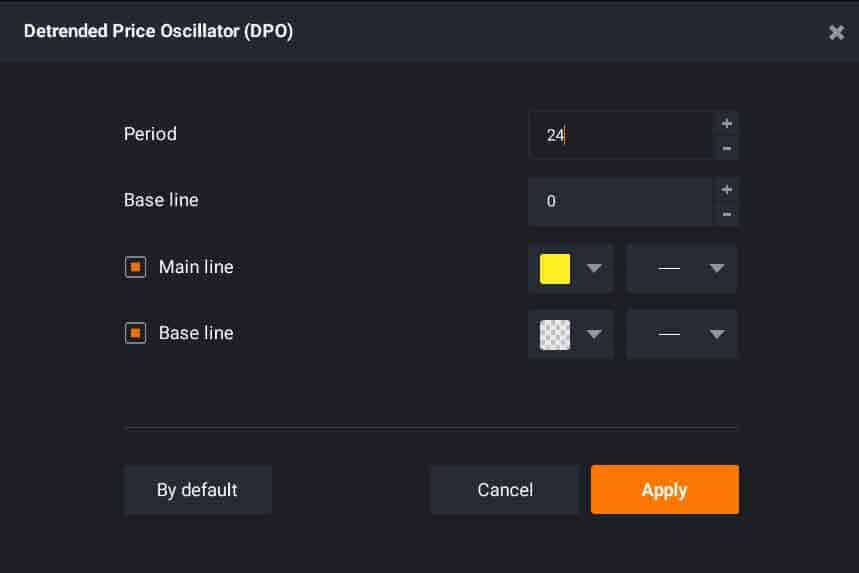
To set the strategy up, add the Rainbow MA with a starting period of 2 and a bands count of 10, using Close as the source. Add KDJ with its period (dK) set to 9, signal (dD) to 4, smoothing to 4, the overbought line at 90 and the oversold line at 10. Keep the chart otherwise clean so the fanned averages and the J line are easy to read at a glance under the pressure of a short expiry.
Entry Rules
- Up trades: take them only when the rainbow layers are fanned out and stacked for an uptrend. Wait for KDJ to dip toward the oversold line and turn back up, then act as the candle closes — not mid-candle.
- Down trades: the mirror image. The layers must be fanned and stacked downward, and KDJ should push up toward the overbought line and roll over before you commit.
- Stand aside: the moment the averages tangle, or KDJ disagrees with the direction the rainbow is showing. A ranging chart is where these indicators produce the most false signals.
When the Strategy Fails
Both tools lag. A moving average only turns after price has already moved, and KDJ can flip on a single sharp candle. In choppy, sideways conditions they whipsaw, firing an entry signal that reverses on the very next bar. Confirming on candle close and refusing to trade a tangled rainbow removes a large share of those bad reads. Test the settings on a demo account first so the reads feel natural, and treat every signal as decision support rather than instruction. Risk control does the rest: stake a small, fixed fraction of your balance per trade and stop for the day once you hit a preset loss limit.
If you want to see the KDJ oscillator used in another context, this walkthrough of IQ Option Hi Low Bands with KDJ covers its timing role on a fast chart, while the IQ Option weighted moving average guide breaks down a single-average approach to trend. For a simpler starting point, the IQ Option 1 minute strategy is a good companion read.
FAQ
Does the Rainbow MA and KDJ combination predict where price is going?
No. Both indicators are calculated from prices that have already printed, so they describe momentum that already exists rather than forecasting the next move. Used together they help you read direction and time an entry, but losing trades are a normal part of trading and no setting removes them.
What are the recommended settings?
Rainbow MA at a starting period of 2, bands count 10, source Close; KDJ at period 9, signal 4, smoothing 4, with the overbought line at 90 and oversold at 10. Every indicator used here is included in the single $39 lifetime plan.
When should I avoid this strategy?
Whenever the rainbow layers are tangled and crossing, which signals a ranging market. In those conditions the averages and KDJ give conflicting, unreliable reads, and standing aside protects your consistency more than forcing a trade does.
This content is for educational purposes only. Trading involves risk. Past results do not guarantee future outcomes. Always practice responsible money management and limit your daily trades to avoid large losses.