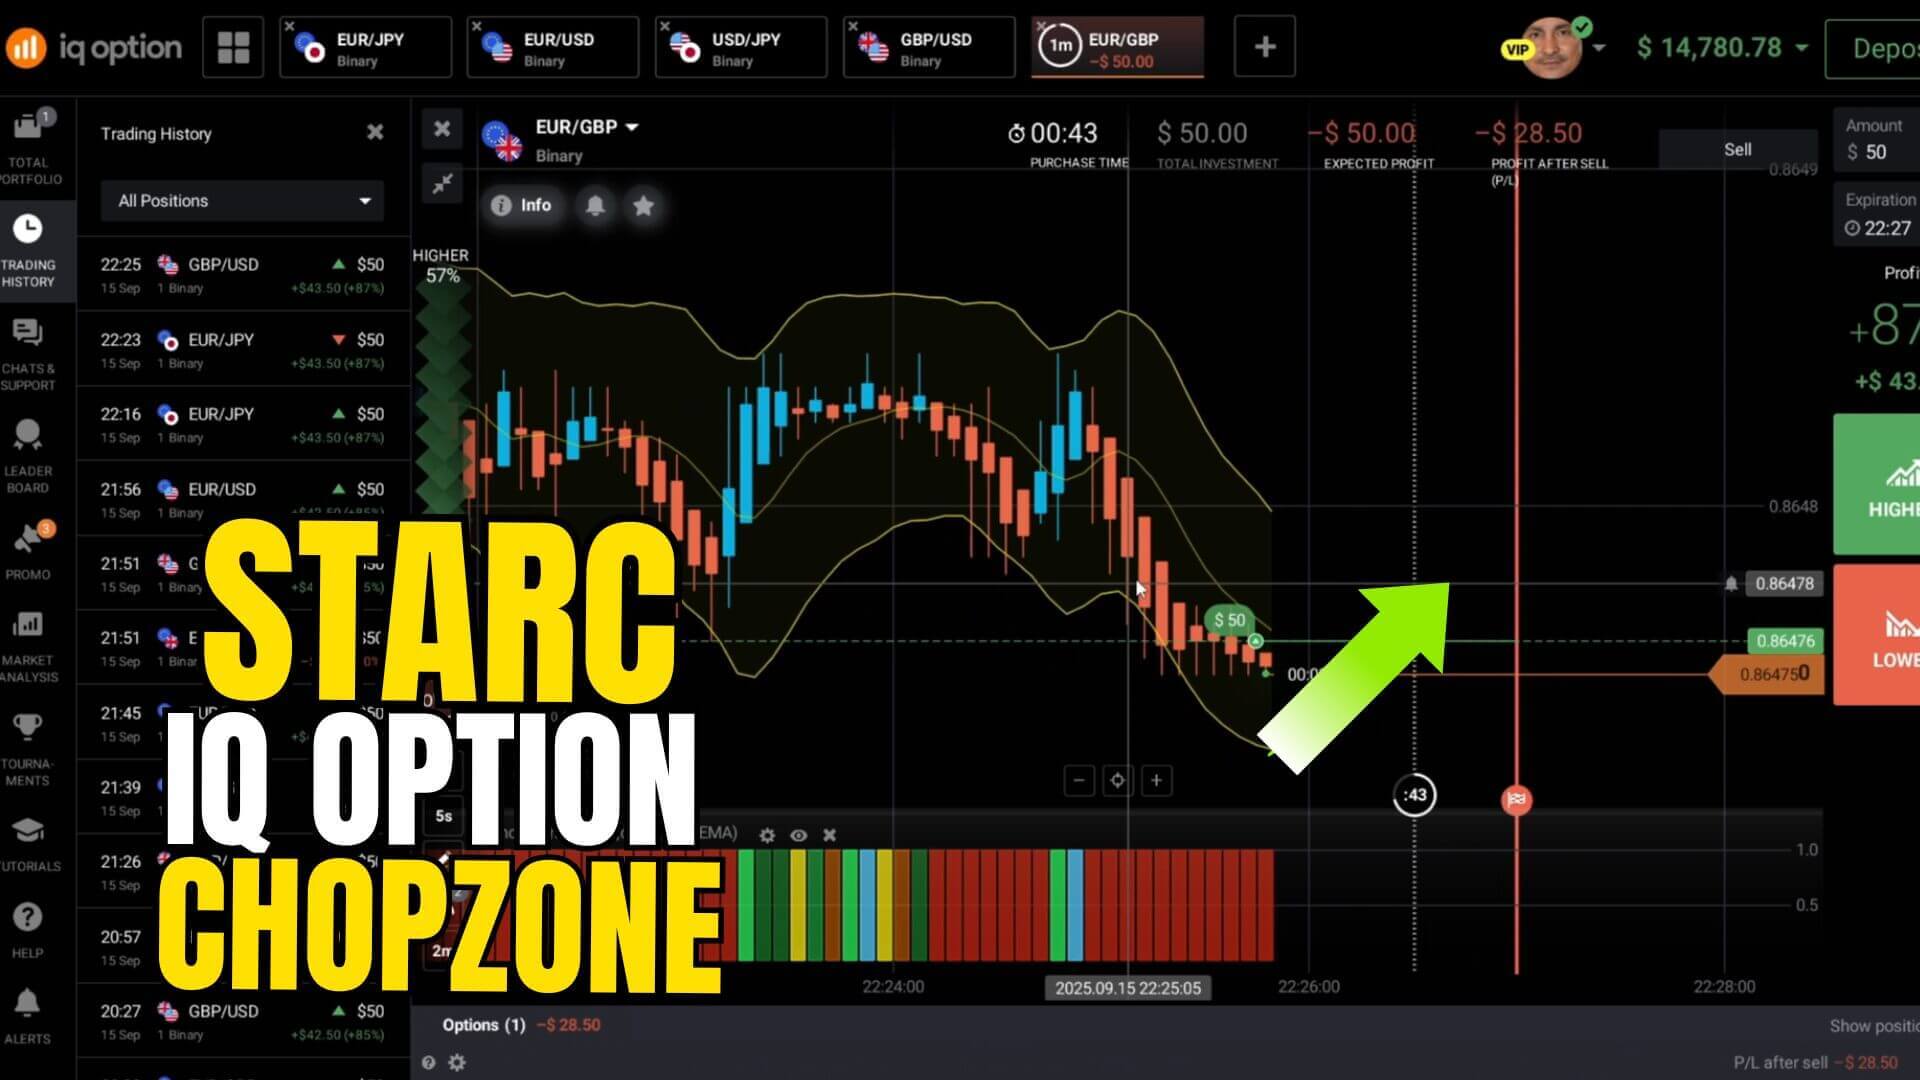
How to Trade IQ Option Using STARC Bands and Chop Zone
Most band strategies fail the same way: a trader sees price tag the outer edge of an envelope, assumes it has gone too far, and fades it — right as a real trend gets going. STARC Bands and Chop Zone pair well because they answer different questions. STARC Bands tell you how stretched price is. Chop Zone tells you whether that stretch means anything. In that order, the second is the gatekeeper for the first.
What STARC Bands Actually Measure
STARC stands for Stoller Average Range Channel. The centre line is a short moving average, and the bands sit a multiple of the Average True Range above and below it. Because ATR expands when candles get large and contracts when they get small, the channel breathes with the market rather than sitting at a fixed distance. A touch of the upper band does not mean price is "too high" in any absolute sense — it means price has travelled an unusual distance for its own recent range. In a quiet, rotating market that stretch usually snaps back. In a committed trend, price can crawl along the band while the band keeps sliding away. Same signal, opposite outcome. That ambiguity is what Chop Zone solves.
What Chop Zone Adds
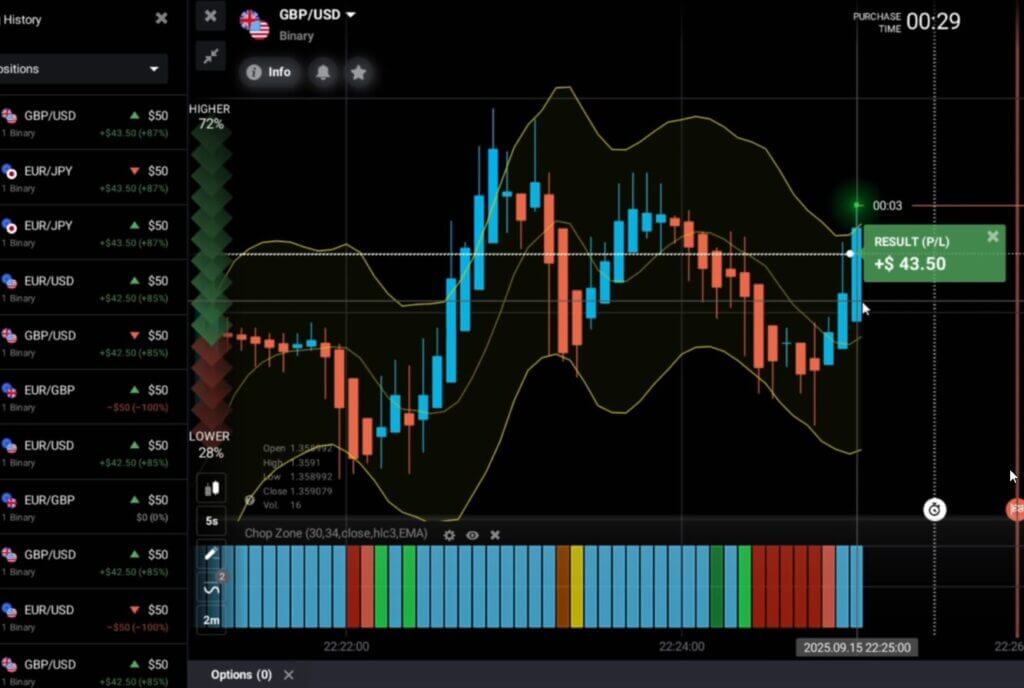
Chop Zone is a classification tool, not a direction tool. It reads the slope and alignment of a set of moving averages and colours the result: one colour family says the market is trending, another says it is chopping sideways. It will not tell you whether to buy or sell — it tells you which STARC behaviour you are dealing with, the mean-reverting one or the trend-riding one. A deeper walkthrough of that colour scale is in our guide to the Chop Zone method on IQ Option, and for background on ATR-based tools see advanced ATR trading on IQ Option.
The Setup
- Chart: 5-second candles
- Expiry: 1 minute
- STARC Bands: Period 13, Multiplier 1.35
- Chop Zone: default settings
- EMA: period 5, used to read the immediate slope
The 13-period, 1.35-multiplier combination is deliberately tight: close enough that touches happen often enough to study, without hugging every candle. If the bands are touched constantly, widen the multiplier rather than lowering the period — the period controls responsiveness, the multiplier controls how far price must travel to reach the band.
Entry Logic and Confirmation
- Call (buy / up): price touches the lower STARC Band, the EMA(5) turns up out of the touch, and Chop Zone is not showing a strong trend against you.
- Put (sell / down): price touches the upper STARC Band, the EMA(5) rolls over, and Chop Zone agrees the move is exhausted rather than building.
- Stand aside: Chop Zone shows a firm trend and price is riding the band in that trend's direction. This setup looks tempting and is most likely to run you over.
Note the order: the band touch draws your eye, but Chop Zone makes the decision.
When This Pairing Fails
Two failure modes are worth naming honestly. The first is the transition: Chop Zone lags because it is built from moving averages, so as a range breaks into a trend it may still print range colours while price is already committing. Every band touch in that window looks valid and behaves badly. The second is news — a release blows the ATR out, the bands widen, and the link between distance and reversion breaks down. Neither is fixable with settings; sit out transitions and news windows instead.
The speed of this configuration is its own risk. Five-second candles with a one-minute expiry leave little time to think, which is why the rules must be decided before the candle forms, not during it. Practise on an IQ Option demo account until standing aside feels as automatic as entering. Use a small fixed stake, cap your trades per session, and stop at a preset daily loss limit. Never increase your stake to chase back a loss — each trade is independent of the last, so doubling down does not improve the next outcome, it only concentrates more of your account into a single result. Consistency comes from the rules you follow, not from any indicator.
IQ Option STARC Bands and Chop Zone
FAQ
Do I need both indicators, or is STARC enough on its own?
You can plot STARC Bands alone, but you lose the filter that makes a band touch readable. Without a trend/range classification there is no principled way to tell a stretch that will revert from one that keeps going.
Can I use different STARC settings?
Yes. Period 13 with a 1.35 multiplier is a starting point tuned for very short timeframes, not a fixed rule. Adjust the multiplier first, one step at a time, and record how touch frequency changes on a demo account. Every indicator on the site is included with the single $39 lifetime plan.
Does this work on other trading platforms?
The logic travels anywhere both indicators are available, since neither is specific to IQ Option. The settings above are tuned to the 5-second chart, so on platforms with different candle granularity, re-test the period and multiplier. For a slower variation, see the IQ Option 1 minute strategy.
This content is for educational purposes only. Trading involves risk. Past results do not guarantee future outcomes. Always practice responsible money management and limit your daily trades to avoid large losses.