Trading the IQ Option OTC Market with a Breakout Indicator
The IQ Option OTC market is where a lot of new traders end up, often without understanding what it actually is. This guide explains what OTC really means, what a breakout indicator flags on those charts, and how to build a rule-based routine around it while keeping risk under control. A breakout signal is a prompt to look closer, not a promise that price will keep running - some of the strongest-looking breakouts fail, and planning for that is the whole game.
What OTC Actually Is
OTC stands for over-the-counter. On IQ Option and similar trading platforms, OTC pairs are synthetic instruments priced by the platform itself rather than pulled from the interbank forex market. Two things follow. First, OTC symbols keep trading on weekends and holidays when the real currency market is closed, which is why they exist. Second, they can behave differently from the live pair of the same name - ranges, the way levels hold, and reaction to news can all differ. Treat an OTC chart as its own market, not a stand-in for the real EUR/USD.
What a Breakout Indicator Flags
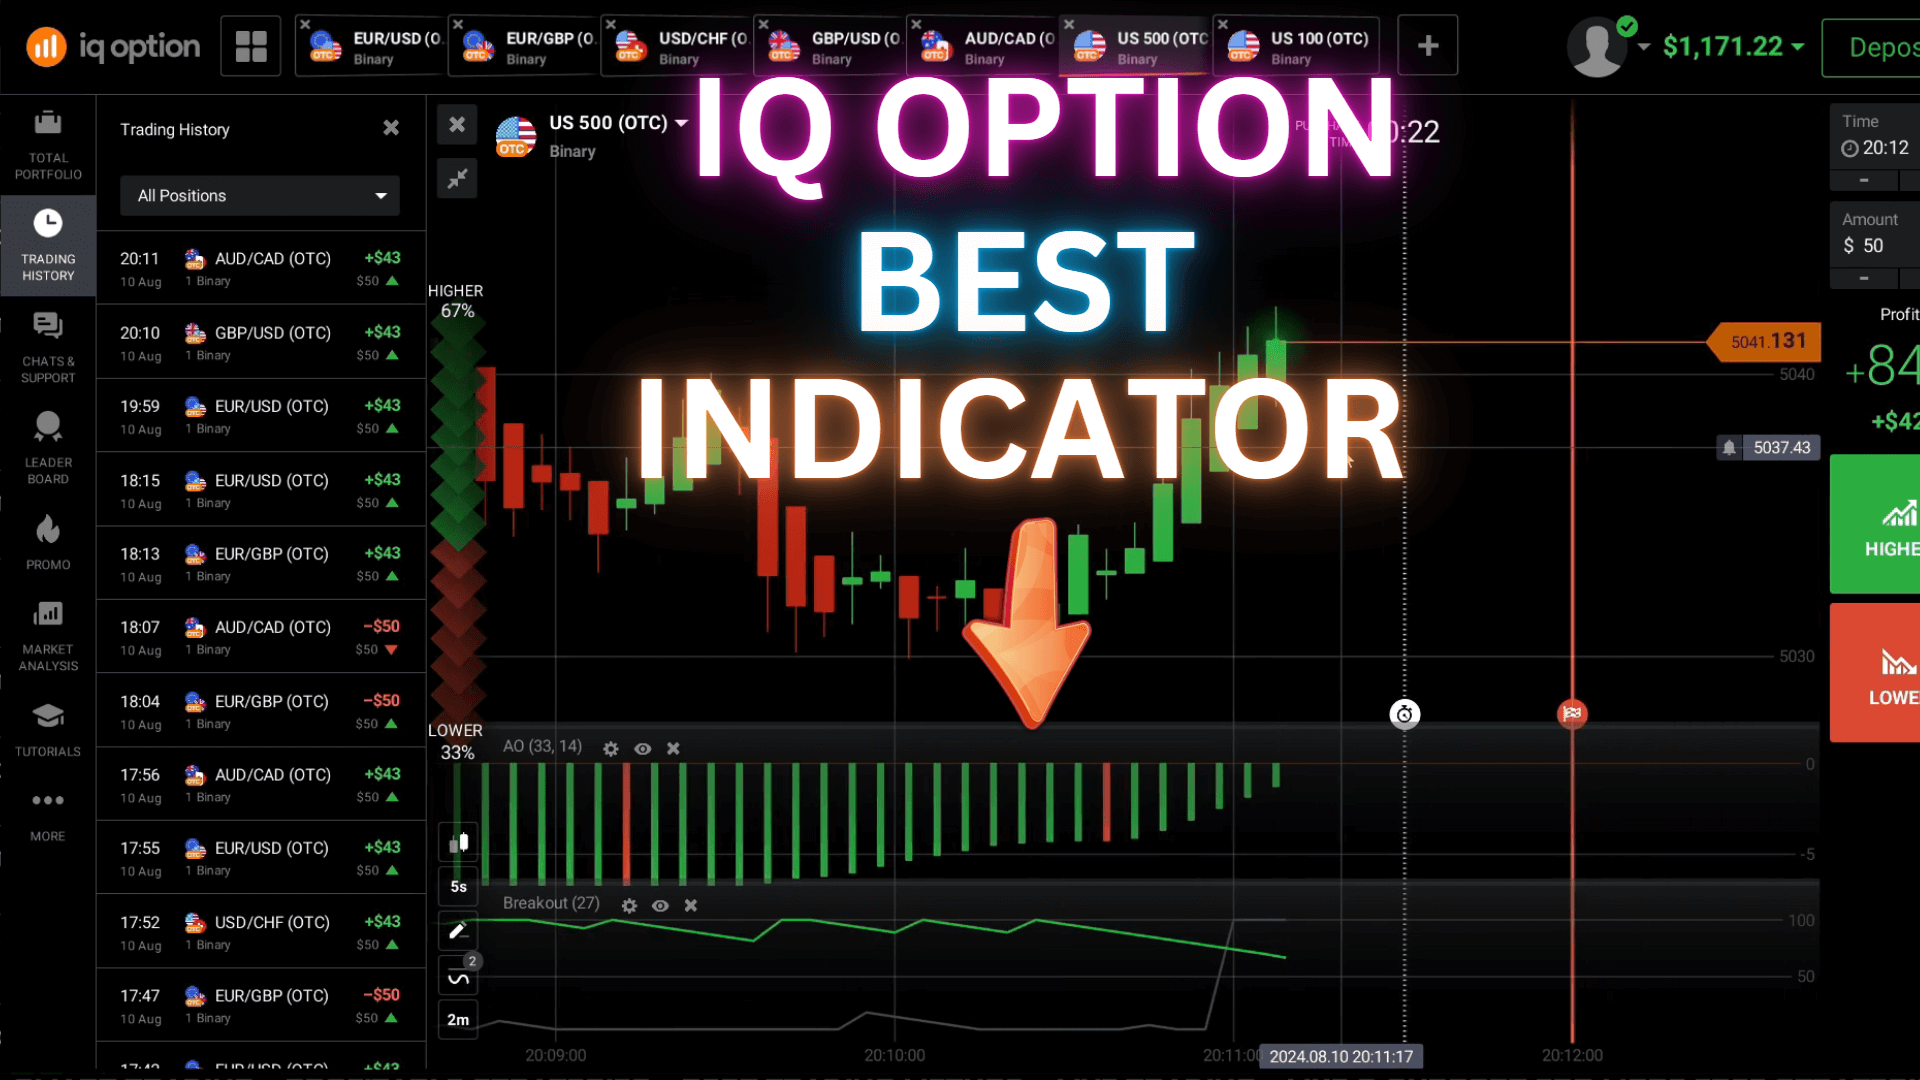
A breakout indicator watches for price pushing past a defined level - the top of a recent range, a prior swing high or low, or a plotted band. When price crosses that level, the tool marks it, the idea being that a decisive break can lead to continuation. The breakout script used here draws those levels and highlights the cross so you are not eyeballing it under time pressure.
The honest caveat is the false breakout. Price often pokes past a level, triggers entries, then snaps straight back inside the range - a fakeout that hands losses to anyone who chased the first flicker. False breakouts are common on the compressed ranges of short-expiry OTC charts, so a breakout signal on its own is never enough. You need confirmation and a rule for when to stand aside.
The Setup and Entry Logic
The workflow pairs the breakout level with a momentum read so you are not acting on the cross alone:
- Up setup: price closes past the upper breakout level and momentum is turning up with it. A candle that breaks and holds above the line, rather than a long wick that immediately retraces, is the cleaner read.
- Down setup: price closes below the lower breakout level while momentum is rolling over. Look for the break to hold on the close, not an intrabar spike.
- Stand aside: the break happens on a single stretched wick, momentum disagrees with the direction, or the market is chopping sideways with no clear range. Skipping these low-quality signals is the single biggest factor in trading with more consistency.
Confirmation matters because it filters out fakeouts. Waiting for the candle to fully close past the level removes a large share of the wick-driven false breaks that trap early entries.

Recommended Settings
Keep the breakout indicator on its default level sensitivity so it marks meaningful range boundaries rather than firing on every small wiggle. Read it on the one-minute chart against a one-minute expiry, which suits the short-term nature of OTC. Trade only a couple of OTC symbols you know well rather than jumping across the whole list. Let every candle fully form before you judge the break, and keep the chart clean. If conditions are choppy, stepping up to a two-minute reading can cut down on weak signals.
When It Fails, and Managing Risk
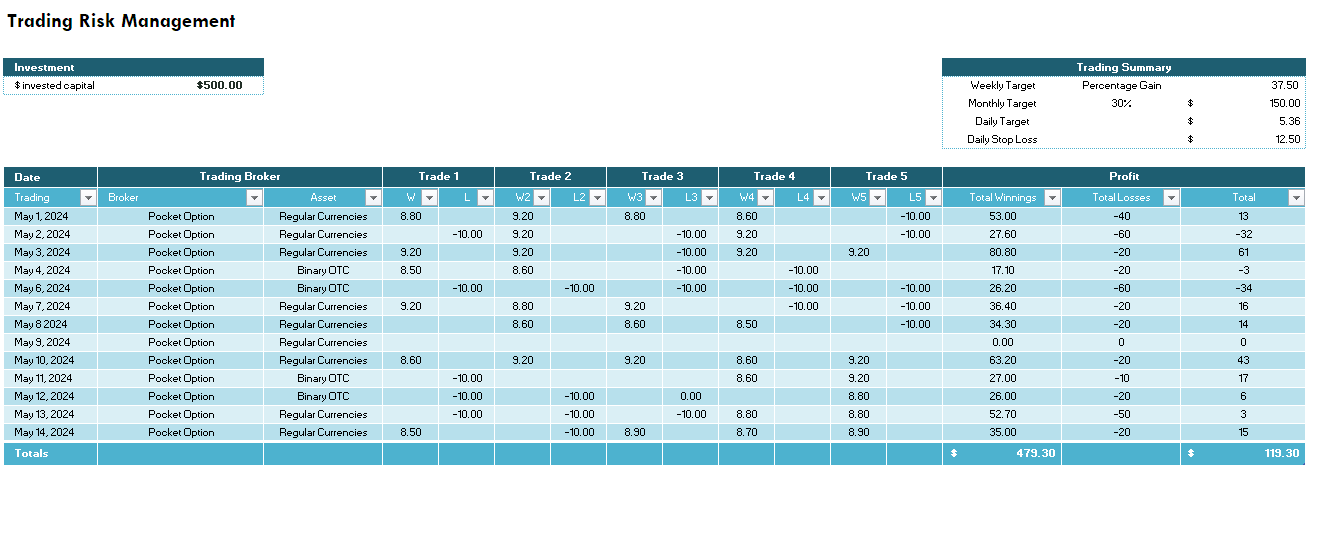
This method fails in flat, directionless markets where price drifts across the level, and in thin conditions where a single spike triggers a break that does not hold. No indicator removes losing trades, so risk control is what keeps you in the game. Stake a small, fixed fraction of your balance on each position, cap the number of trades in a session, and stop for the day once you hit a preset loss limit. A structured risk management routine helps you log trades and hold your limits. Avoid the trap of increasing your stake to chase back a loss - that martingale-style doubling can wipe an account in a short losing streak. Fixed, repeatable sizing is safer every time.
Practice on a demo account until the reads feel automatic before risking real funds, and see how the same tool is applied in this IQ Option 1 minute strategy and the broader IQ Option script guide.
FAQ
Is the OTC market the same as regular forex?
No. OTC symbols are synthetic instruments priced by the trading platform, which is why they run on weekends when the real forex market is closed. They can behave differently from the live pair of the same name, so treat each OTC chart as its own market.
Why do breakouts keep failing on me?
False breakouts are normal, especially on short-expiry OTC charts. Price often pokes past a level then snaps back inside the range. Waiting for a full candle close past the level, and confirming with momentum, filters out many of these fakeouts.
Where can I get the breakout indicator?
The breakout script and every other indicator on the site are included with a single $39 lifetime plan. There is no subscription, and updates are included.
This content is for educational purposes only. Trading involves risk. Past results do not guarantee future outcomes. Always practice responsible money management and limit your daily trades to avoid large losses.