Why Heiken Ashi and Only One Moving Average
Most short-expiry setups fail for the same reason: too many indicators disagreeing with each other at ten seconds per candle. This one strips the chart down to two things. Heiken Ashi candles average each bar against the previous one, so a genuine push shows up as a run of same-coloured bodies instead of the red-green-red flicker of normal candlesticks. A single 22-period Simple Moving Average then answers one question — is price above or below it.
That leaves a signal you can state in one sentence: a run of same-coloured Heiken Ashi candles on the correct side of the SMA 22. It is deliberately narrow, and that narrowness is what makes it something an AI scanner can grade consistently rather than guess at.
The Chart Setup on Olymp Trade
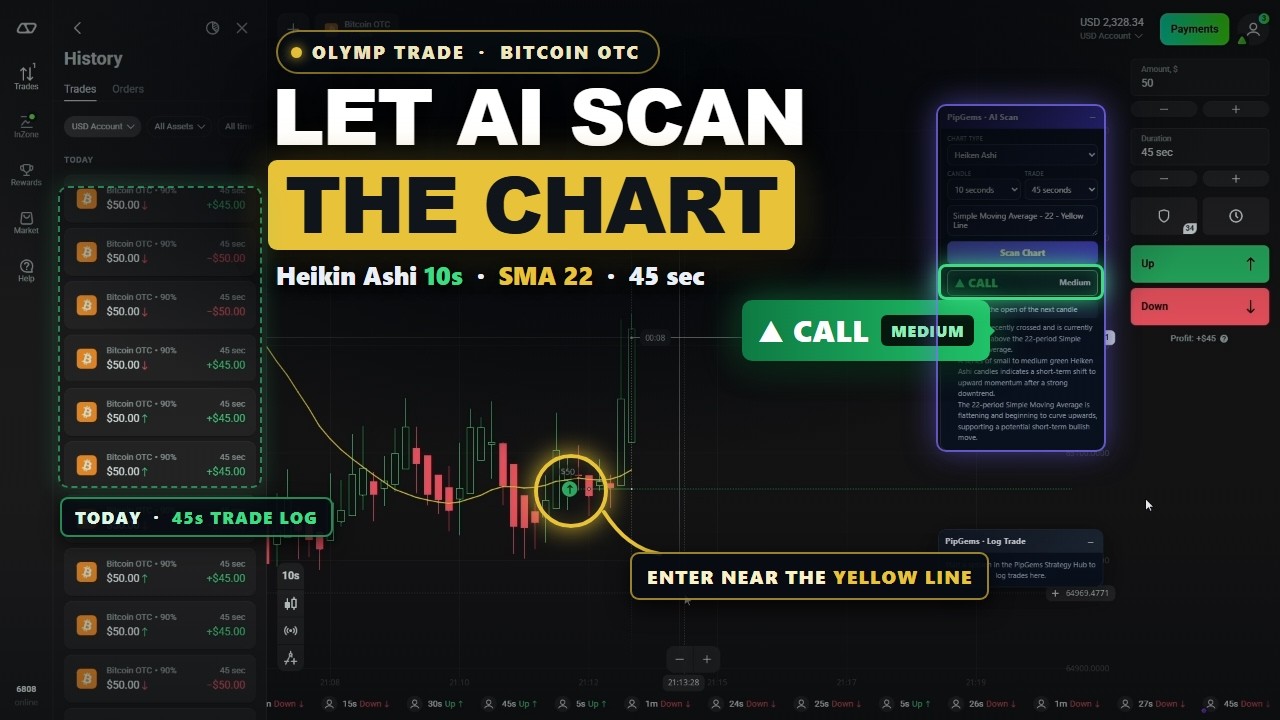
- Platform: Olymp Trade, Fixed Time trades on a demo/practice balance
- Asset: Bitcoin OTC at a 90% payout
- Chart type: Heiken Ashi (not standard candlesticks)
- Candle timeframe: 10 seconds
- Trade duration: 45 seconds (roughly 4–5 candles of room)
- Indicator: Simple Moving Average, period 22, coloured yellow — the only line on the chart
- Stake: fixed $50, so a win returns +$45 and a loss costs the full $50
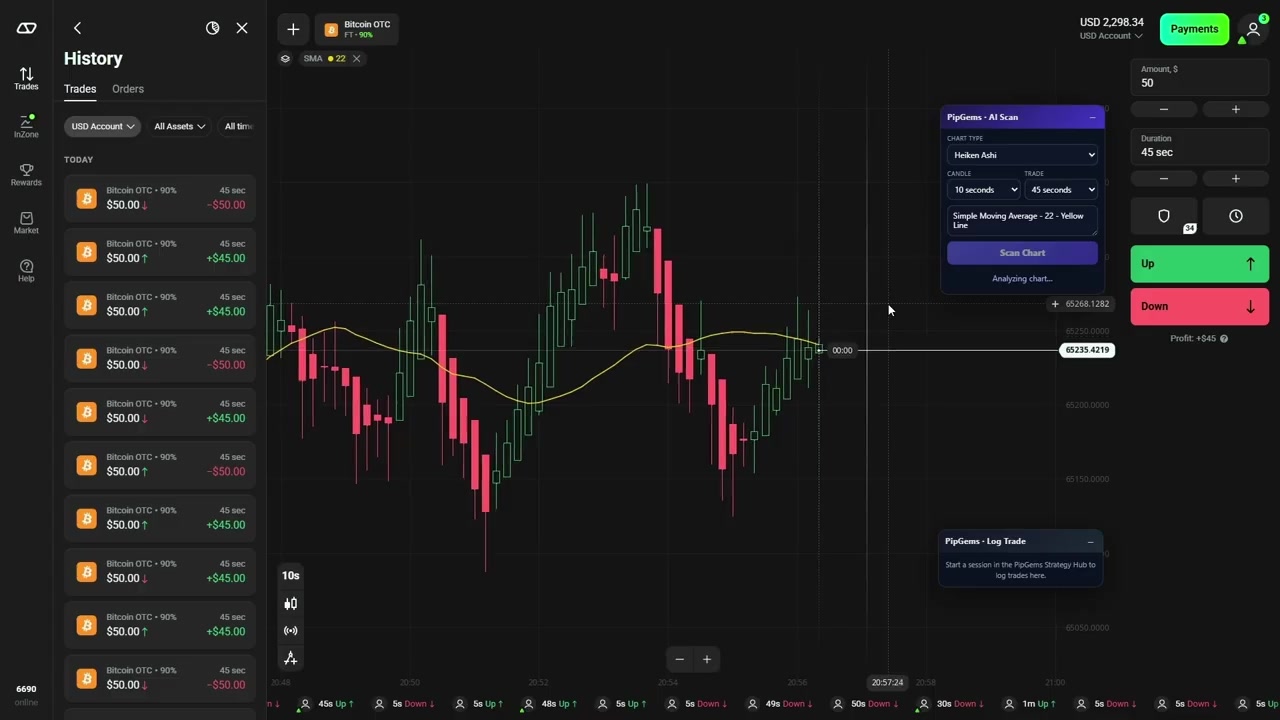
The scanner panel on the right is where the setup is declared, and the fields matter — this is the part people get wrong. Chart type: Heiken Ashi. Candle: 10 seconds. Trade: 45 seconds. The notes box says "Simple Moving Average - 22 - Yellow Line", which is how you tell the AI what the yellow line actually is. Describe the line and it reasons about it; leave it blank and the scanner is looking at a coloured line with no meaning attached.
How the Scanner Reads the Chart
Pressing Scan Chart returns a direction, a confidence level, and — most usefully — the reasoning behind it. Every signal also carries the same timing instruction: "Enter at the open of the next candle." On a 10-second chart that instruction is the whole discipline. Entering mid-candle means you are buying into a body that is still forming and may still flip colour.
A High-Confidence PUT
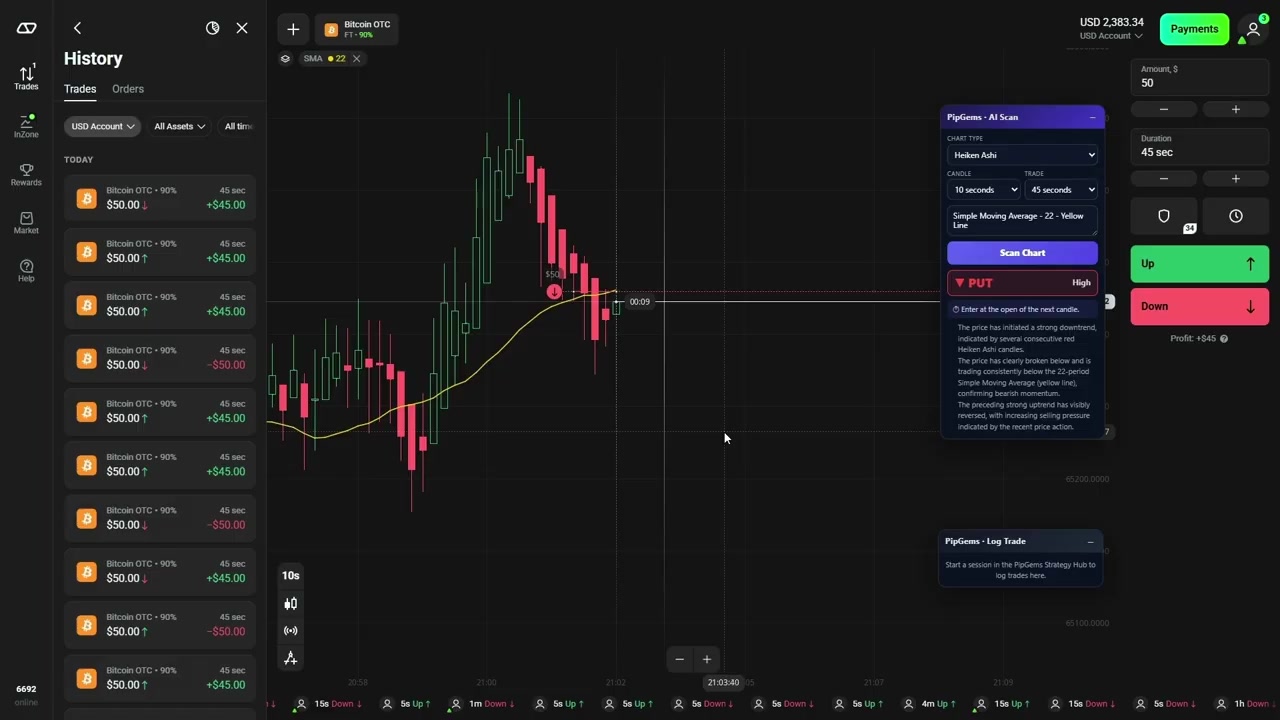
Here the scanner returns PUT marked High, and the reasoning names all three conditions in order: several consecutive red Heiken Ashi candles, price clearly broken below and trading consistently under the 22-period SMA, and a preceding uptrend that has visibly reversed with increasing selling pressure. That is the textbook version of this setup — colour, side of the line, and a reversal already confirmed rather than hoped for.
A High-Confidence CALL
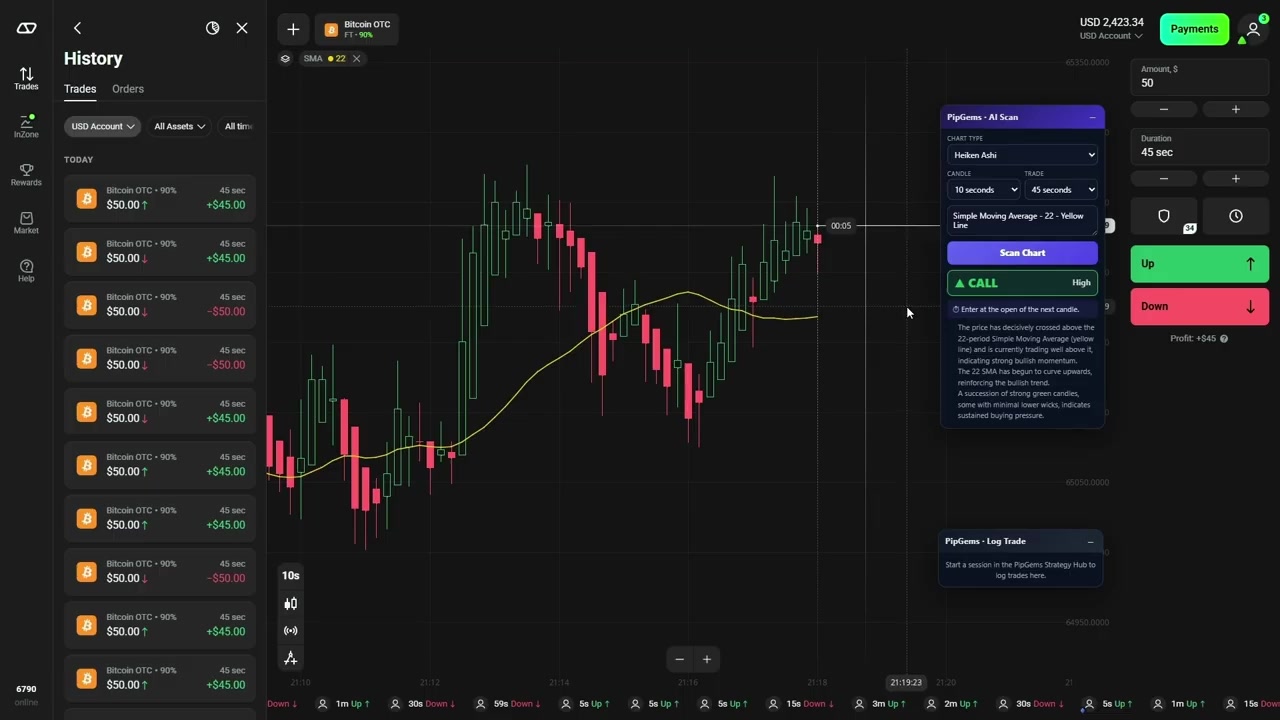
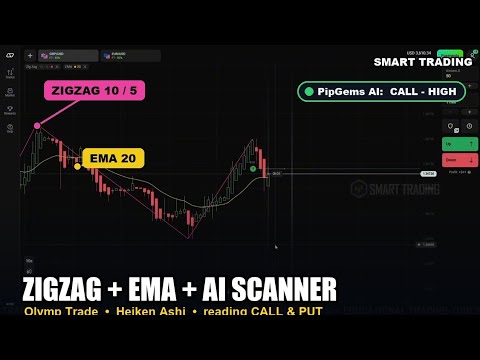
The mirror image: price has decisively crossed above the SMA 22 and is trading above it, the 22 SMA itself has begun to curve upwards, and a succession of strong green candles with minimal lower wicks shows sustained buying. Note the second point — the slope of the line, not just the cross. A cross while the average is still pointing down is a weaker trade than a cross that drags the average with it.
When the Answer Is "Medium"
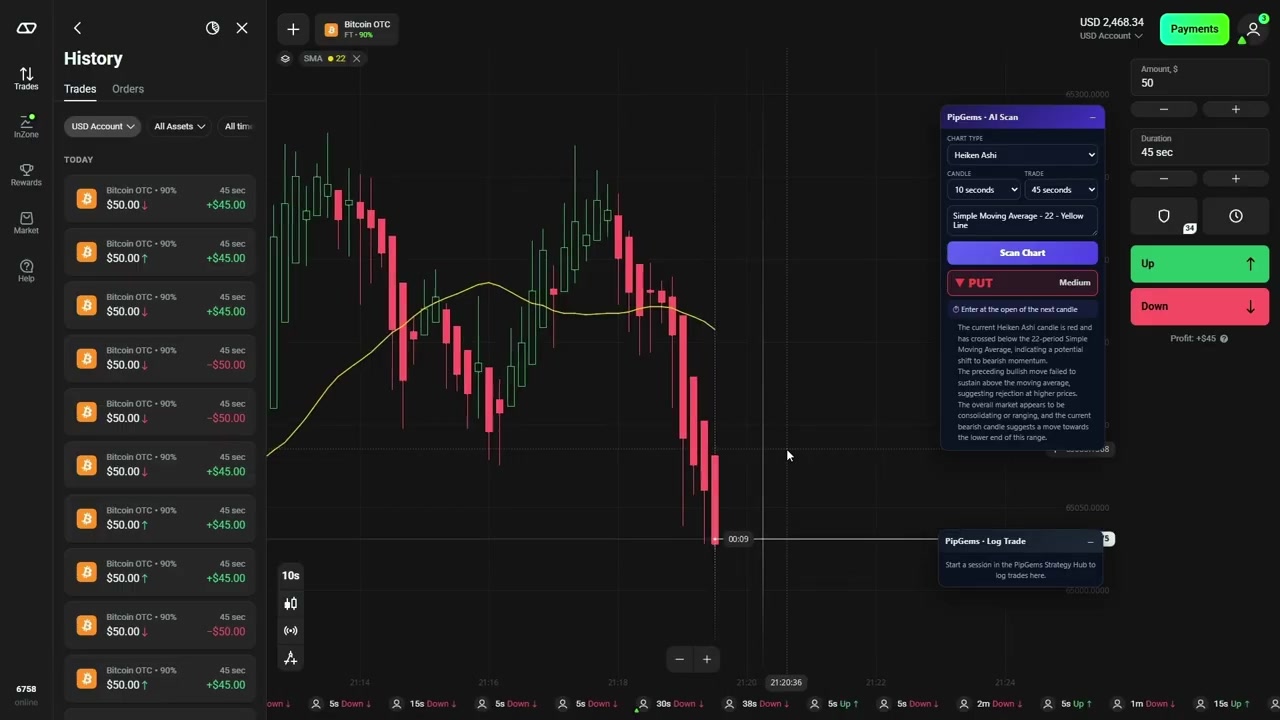
This is the most valuable frame in the whole session. The scanner still says PUT, but grades it Medium — and the reasoning explains exactly why: the current candle is red and has crossed below the SMA, but "the preceding bullish move failed to sustain above the moving average" and "the overall market appears to be consolidating or ranging." The signal fires; the confidence tells you the conditions are messier than the direction suggests. Treating a Medium the same as a High is how a decent setup turns into a losing session.
Watch the Full Session
See the scanner configured from scratch, every CALL and PUT with its reasoning, and the trades running to expiry on Bitcoin OTC:
Why Entries Near the SMA 22 Read More Cleanly
One point the video makes repeatedly: entering close to the yellow line helps the scanner read the setup more accurately. The reason is mechanical. Near the average, the relationship between price and the line is unambiguous — a cross either just happened or it did not. Far above or below it, price is extended, and the honest read is not "strong trend" but "due for a pullback." Extended price is where a run of green candles is most likely to be followed by the snap-back that costs you the trade.
Honest Weaknesses
Four stars, not five — here is the missing star:
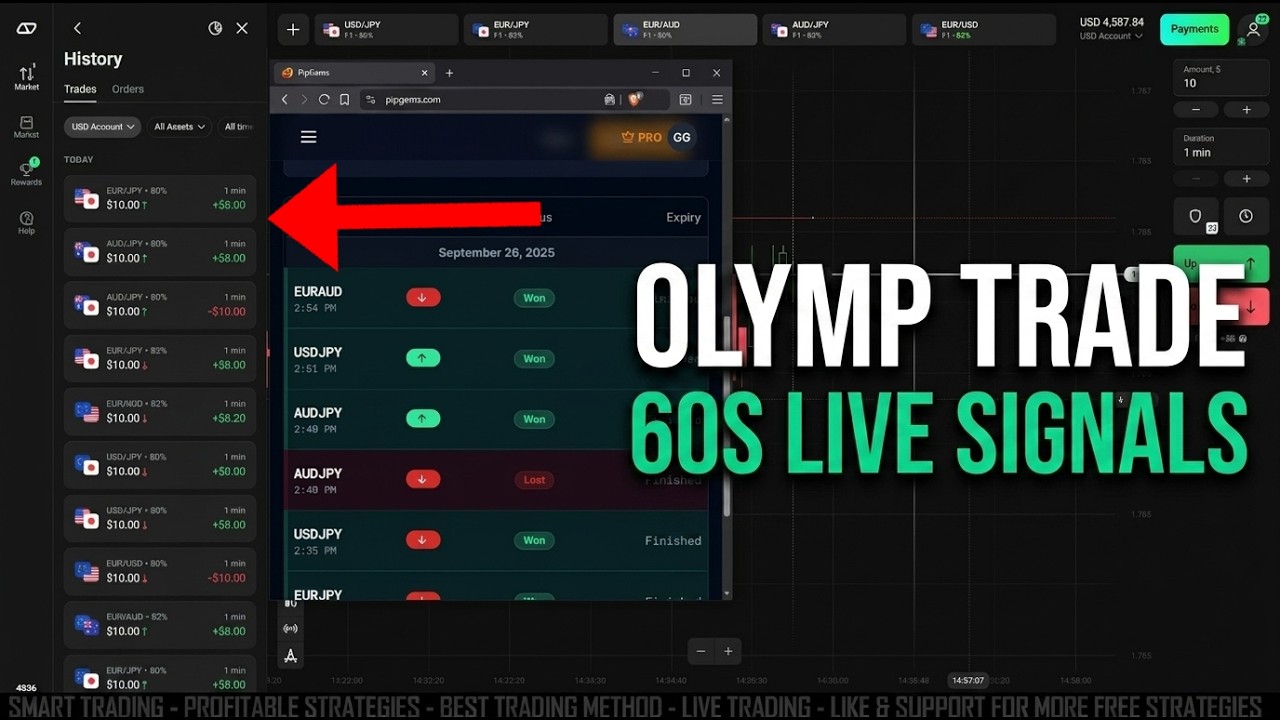
- The trade history is mixed, and visibly so. The sidebar in every frame shows +$45.00 wins next to −$50.00 losses. This is a setup with a real strike rate, not a clean sheet, and the 90% payout means a loss costs more than a win pays.
- Heiken Ashi hides the real price. Those smooth bodies are averaged values, not the actual open and close. Your entry fills at the real market price, which can sit some distance from where the candle appears to be.
- 10 seconds is unforgiving. A 45-second expiry is four or five candles. One unexpected wick against you and there is very little time left to recover.
- OTC is a weekend/quiet-hours market. Bitcoin OTC pricing comes from the broker, not an open exchange order book. Behaviour there is not identical to the live market, so results on OTC do not transfer one-for-one.
- The AI is a reader, not an oracle. The scanner describes what is already on the chart, clearly and quickly. It cannot know what the next candle does — which is precisely why it publishes a confidence level.
Risk Management Rules
- Enter at the open of the next candle, exactly as the scanner instructs. No mid-candle entries.
- Take the High confidence signals and skip or halve the Medium ones — especially when the reasoning uses the word "ranging."
- Require the candle colour and the side of the SMA 22 to agree. If the AI says PUT while candles are turning green above the line, stand down.
- Keep the stake fixed. Never raise it to recover a loss — at a 90% payout, chasing digs the hole faster than it fills it.
- Set a hard daily loss cap in advance and stop when you reach it.
- Practise the whole routine on a demo balance first — the session in the video is a demo account.
The Verdict
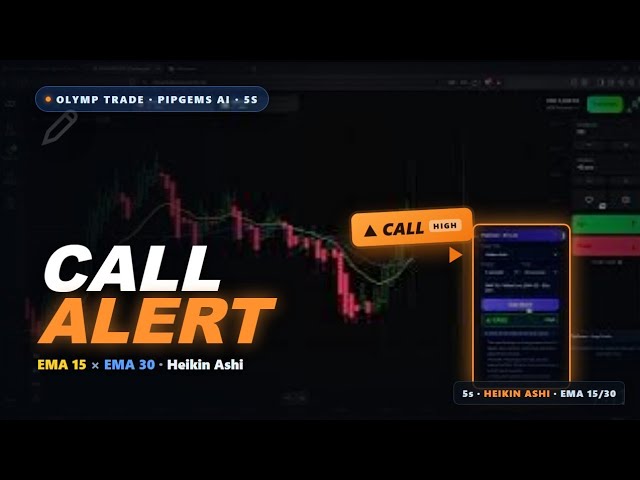
A solid 4 out of 5. What earns it: the setup is genuinely minimal — one chart type, one moving average, one timing rule — so there is nothing to second-guess mid-trade, and it uses indicators already built into Olymp Trade. Pairing it with the AI scanner adds something a static indicator cannot, which is a written reason for every signal plus a confidence level that quietly tells you when to sit out. Compared with our 5-second Heikin Ashi + EMA 15/30 version, the 10-second candles and single SMA give the trade noticeably more breathing room.
What holds it back from five: the losses are right there in the trade history, Heiken Ashi bodies are averaged rather than real prices, and a 45-second expiry on OTC pricing leaves little margin for error. Use it as a disciplined framework — respect the confidence levels, enter on the candle open, keep the stake flat — and it is one of the cleaner short-expiry structures on the platform. Treat every signal as automatically correct and the payout maths will find you out.
#OlympTrade #AITrading #HeikenAshi #PipGems #BitcoinOTC #TradingStrategy #SMA22 #FixedTime #ChartAnalysis
This content is for educational purposes only and is not financial advice. Trading involves substantial risk; you can lose some or all of your capital. No result is guaranteed and past performance does not indicate future results. Trade only what you can afford to lose.