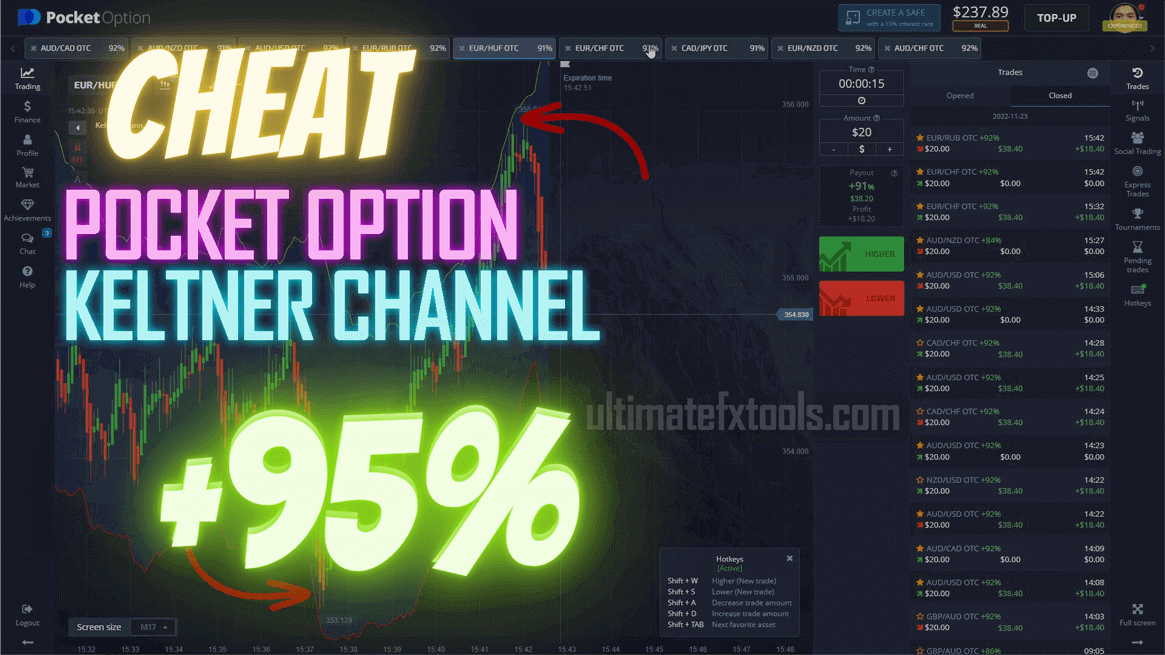
Pocket Option is a chart-based trading platform available in both web and app versions, with built-in tools that make it approachable for newer traders. Its OTC markets allow very short expiry times — 5, 10, 15 and 30 seconds — which is where this Keltner Channel setup is aimed. One of our traders shared how he reads the Keltner Channel on the 15-second OTC chart. Read this first: the channel is decision support, not a promise of an outcome. It shows how stretched price is, and you still confirm the context and manage risk on every trade.
What the Keltner Channel Actually Shows
The Keltner Channel is an envelope drawn around a moving average. A centre line tracks an exponential moving average (EMA) of price, and two outer bands sit above and below it at a distance set by the Average True Range (ATR) — a measure of recent volatility. When the market gets busier, ATR rises and the bands widen; when it quiets down, they contract. In practice the channel gives you a quick read on how far the current price has drifted from its own recent average.
It looks similar to Bollinger Bands, and the two are often compared. The key difference is what sets the band width: Bollinger Bands use standard deviation, while the Keltner Channel uses ATR. Because ATR reacts more smoothly than standard deviation, Keltner bands tend to look steadier and flip direction less often, which some traders find easier to read on a fast chart.
Reversion or Breakout — Why Context Matters
Here is the part traders most often get wrong. A touch of the outer band does not mean one single thing. In a sideways, range-bound market, price tapping the upper band and turning back toward the centre line is a classic reversion signal — it stretched too far and snapped back. But in a strong trend, price can ride along the outer band for many candles as it breaks out, and fading that move means fighting momentum. The exact same band touch is a reversal cue in one context and a continuation cue in another.
That is why the channel should never be traded on its own. Before you act on a band touch, decide which environment you are in. If the centre-line EMA is roughly flat and price is bouncing between the bands, treat touches as possible reversions. If the EMA is clearly sloping and the bands are pointing the same way, respect the trend and be wary of counter-trend entries.
Keltner Channel Settings for Pocket Option
The strategy runs on the 15-second OTC chart. Common starting values for the indicator are an EMA period of 20 for the centre line, an ATR length of 10, and an ATR multiplier of 2 for the band distance. A lower multiplier tightens the bands and gives more frequent touches; a higher one widens them and filters for bigger moves. There is no single correct number — test any change on a demo account first.
- Higher (call): in a flat range, price tags the lower band and prints a rejection candle turning back up toward the centre line.
- Lower (put): in a flat range, price tags the upper band and stalls, turning back down.
- Stand aside: the EMA is trending hard and price is hugging one band — the move is a breakout, not a reversion, so skip the counter-trend trade.
When the Keltner Channel Fails
The most common failure is fading a breakout: treating a trending band-ride as an overextension and betting against it. It also struggles in low-volatility drift where the bands squeeze flat and touches become meaningless noise, and on the very shortest expiries where a single tick can swing the result. No indicator removes losing trades. Keep each stake a small fixed fraction of your balance, cap how many trades you take per session, and stop once you hit a preset daily loss limit.
Bollinger Bands as an Alternative
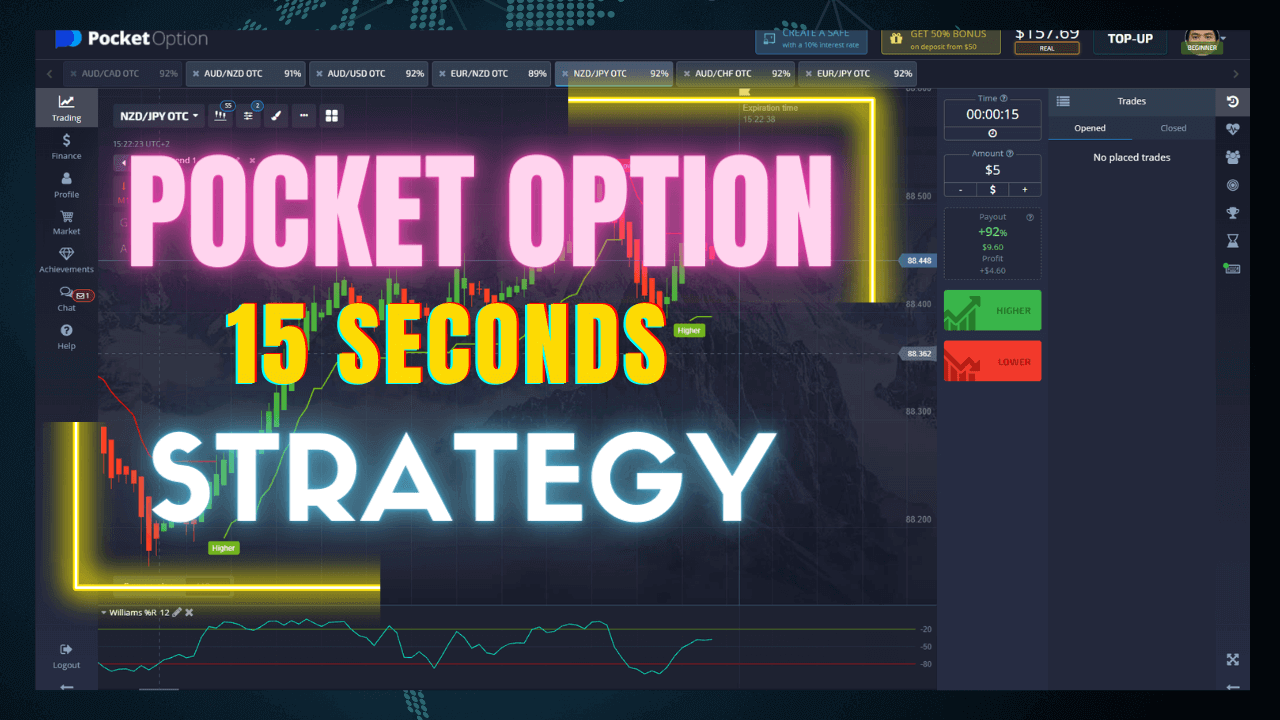
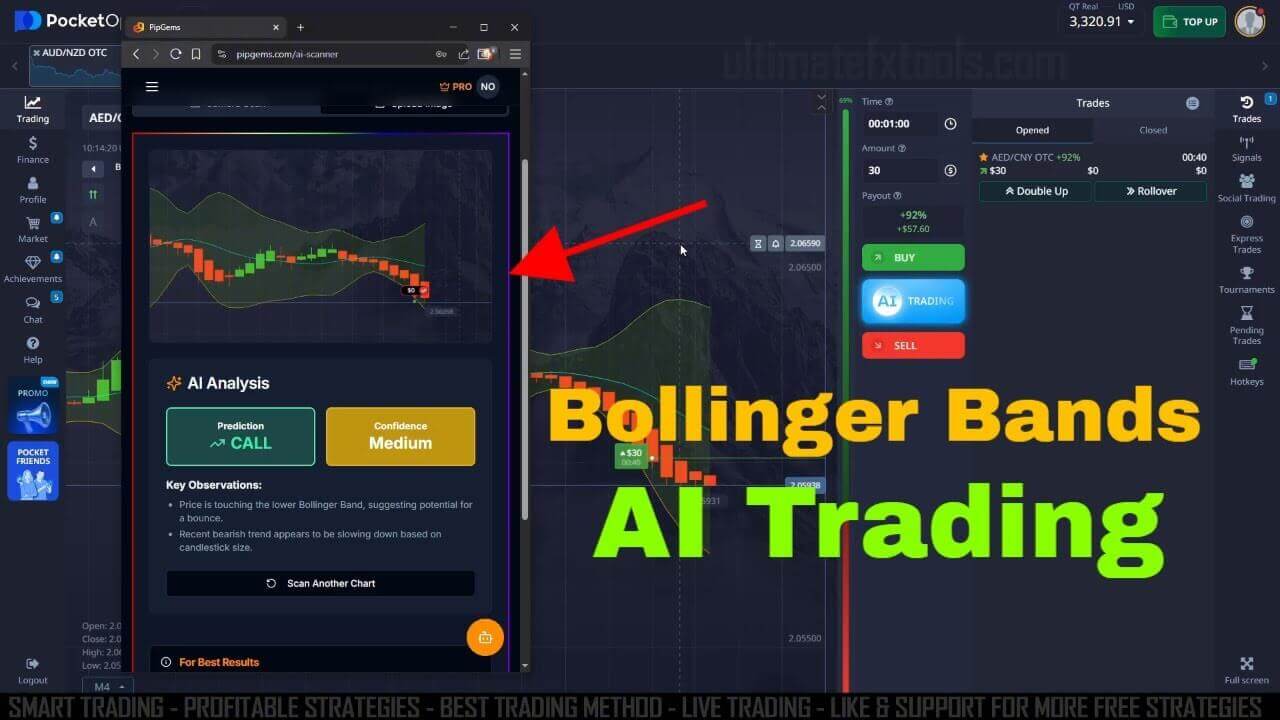
If you prefer a standard-deviation envelope, Bollinger Bands cover similar ground — some traders run a deviation of 3 on a one-minute duration. You can compare the approaches in our Bollinger Bands AI for Pocket Option guide, and see a two-indicator version in the 15 Seconds Pocket Option strategy. For more setups, browse our top Pocket Option trading strategies.
FAQ
Does a Keltner Channel band touch mean price will reverse?
Not by itself. A touch of the outer band signals that price is stretched, but in a strong trend price can keep riding the band. Check whether the centre-line EMA is flat (favouring reversion) or sloping (favouring the trend) before acting.
What is the difference between the Keltner Channel and Bollinger Bands?
Both draw an envelope around a moving average. Bollinger Bands set their width from standard deviation, while the Keltner Channel uses ATR, which reacts more smoothly and tends to produce steadier-looking bands.
Do I need to pay to use this strategy?
No — the Keltner Channel is a standard indicator built into most platforms, so you can apply this method for free. Our optional $39 lifetime plan simply bundles the full library of indicators and strategies if you want more tools in one place.
This content is for educational purposes only. Trading involves risk. Past results do not guarantee future outcomes. Always practice responsible money management and limit your daily trades to avoid large losses.