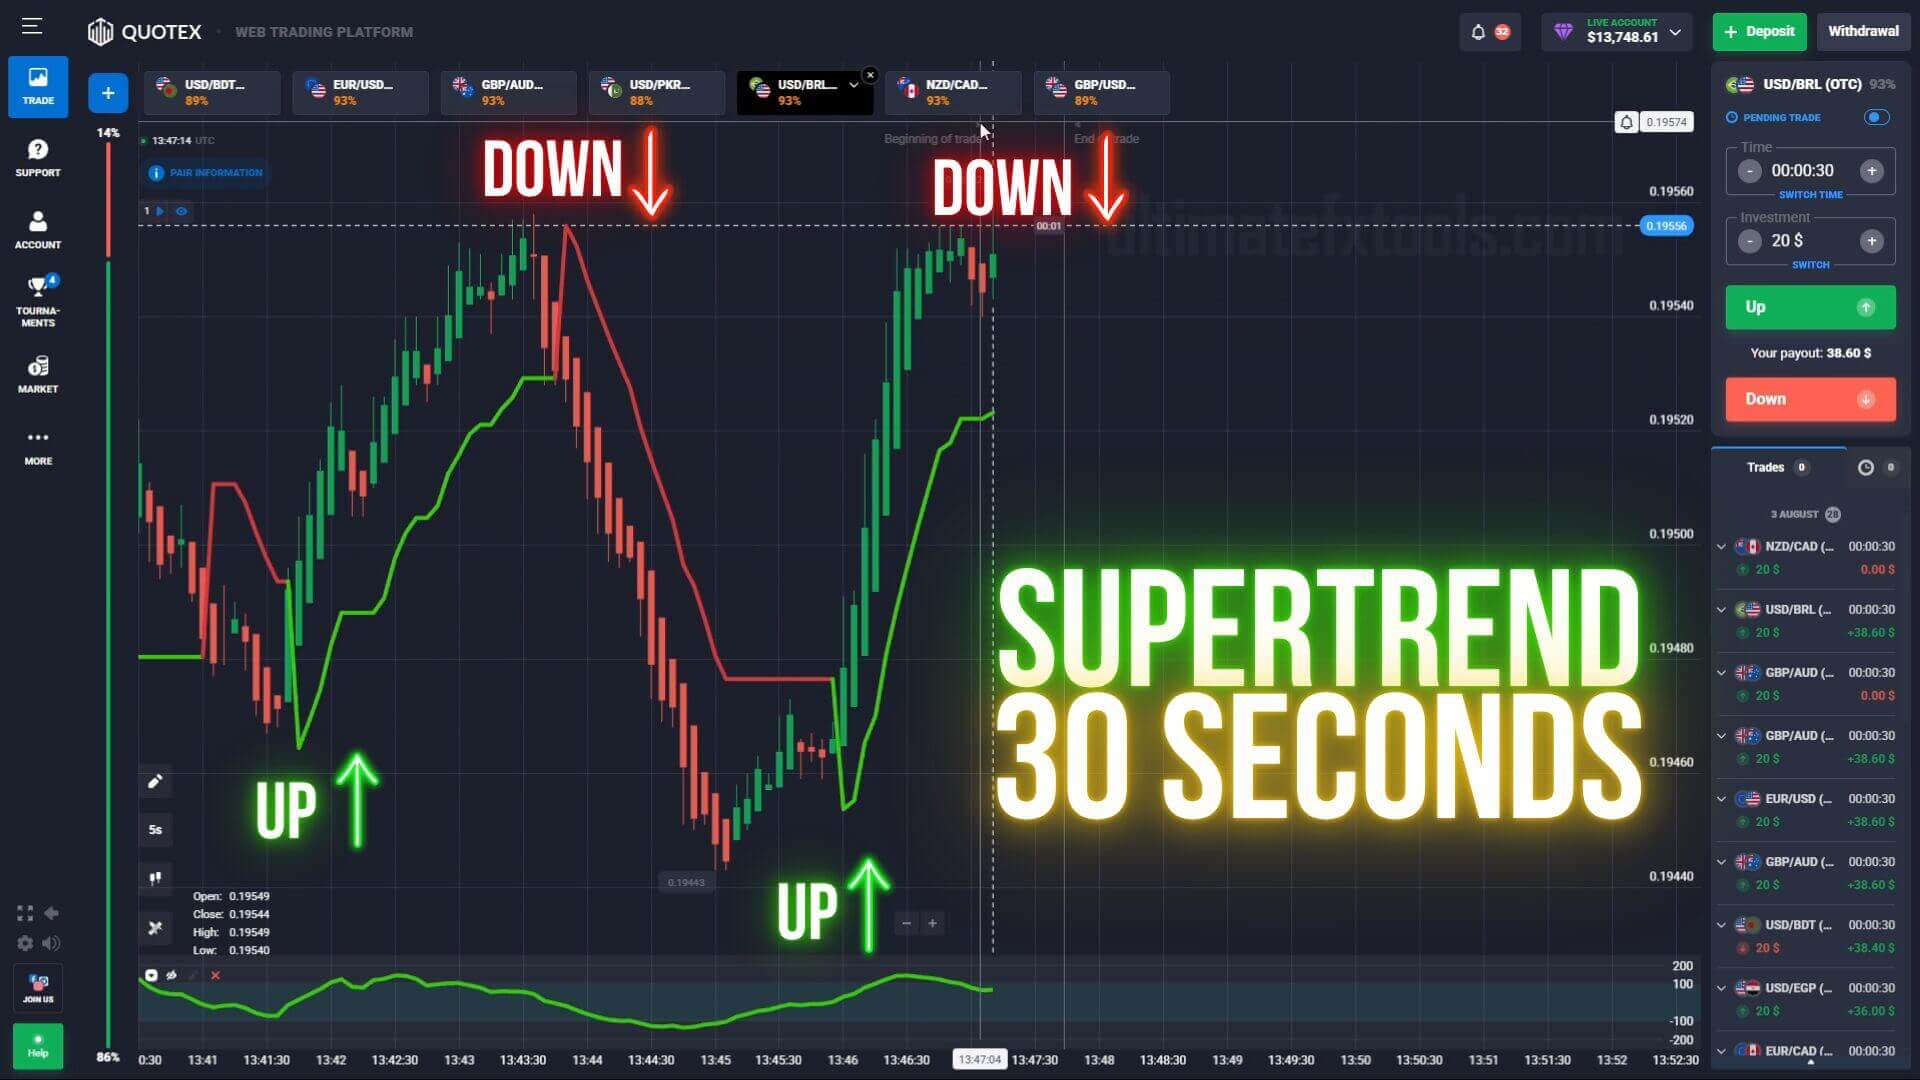
"Quotex Double Supertrend"
"Red & Green Supertrend Lines"
"10 Second Chart Reversal Hack"
What Is the Quotex Supertrend Double Hack?
The Quotex Supertrend Double Hack is a short-term binary options strategy that uses two Supertrend indicators plotted simultaneously on the same chart. By overlaying a red Supertrend (slower, higher period) and a green Supertrend (faster, lower period), traders can visually identify powerful trend convergence zones — the exact spots where momentum peaks and price is most likely to reverse.
This strategy is purpose-built for the Quotex platform, using 10-second candle charts with a 30-second trade duration. It's fast, clean, and highly visual — ideal for traders who want a clear signal without relying on complex indicator stacks.
Indicator Setup: Two Supertrend Lines
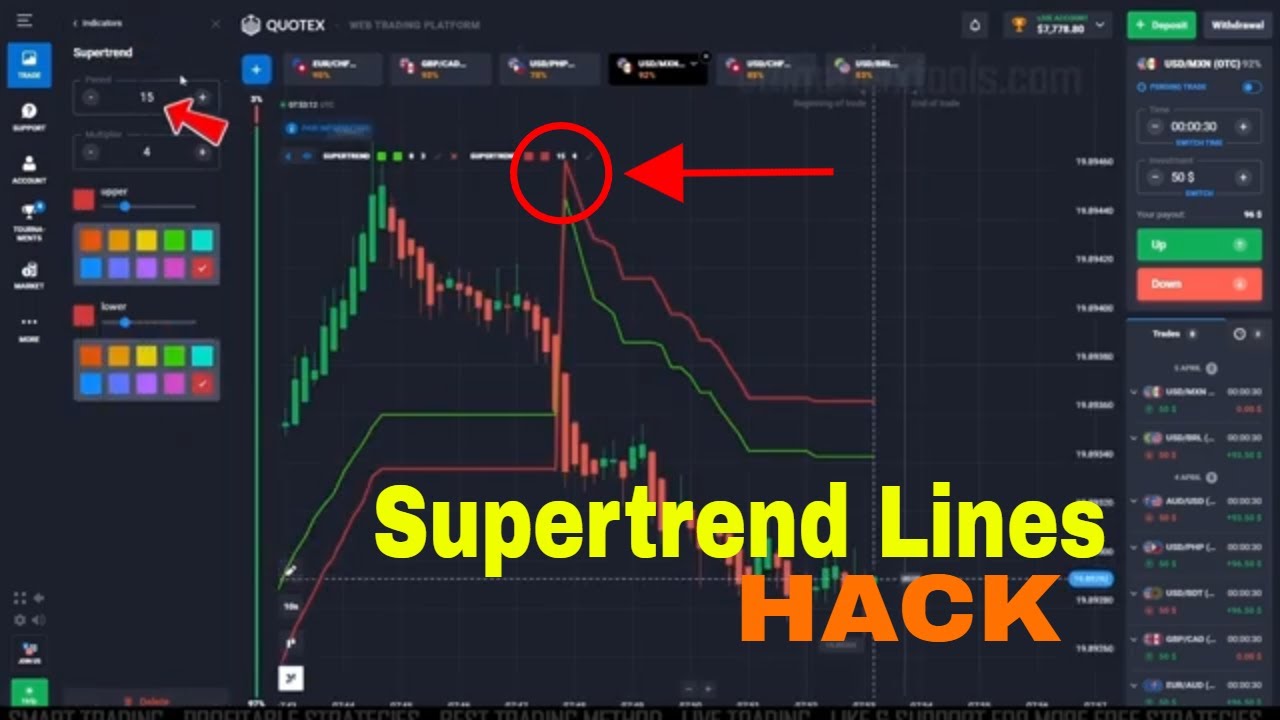
Setting up this strategy correctly takes less than two minutes. You need to add the Supertrend indicator to your chart twice, with different parameters and colours for each. Here is exactly how to configure both:
Supertrend 1 — Red Lines
Supertrend 2 — Green Lines
Color-coding is key. Red lines represent the slower, higher-period indicator — the big-picture trend reference. Green lines represent the faster, lower-period indicator — the one that reacts quickly to price changes. When both sets of lines move in the same direction and begin converging, that is your signal zone.
How to Read the Chart: The Convergence Zone
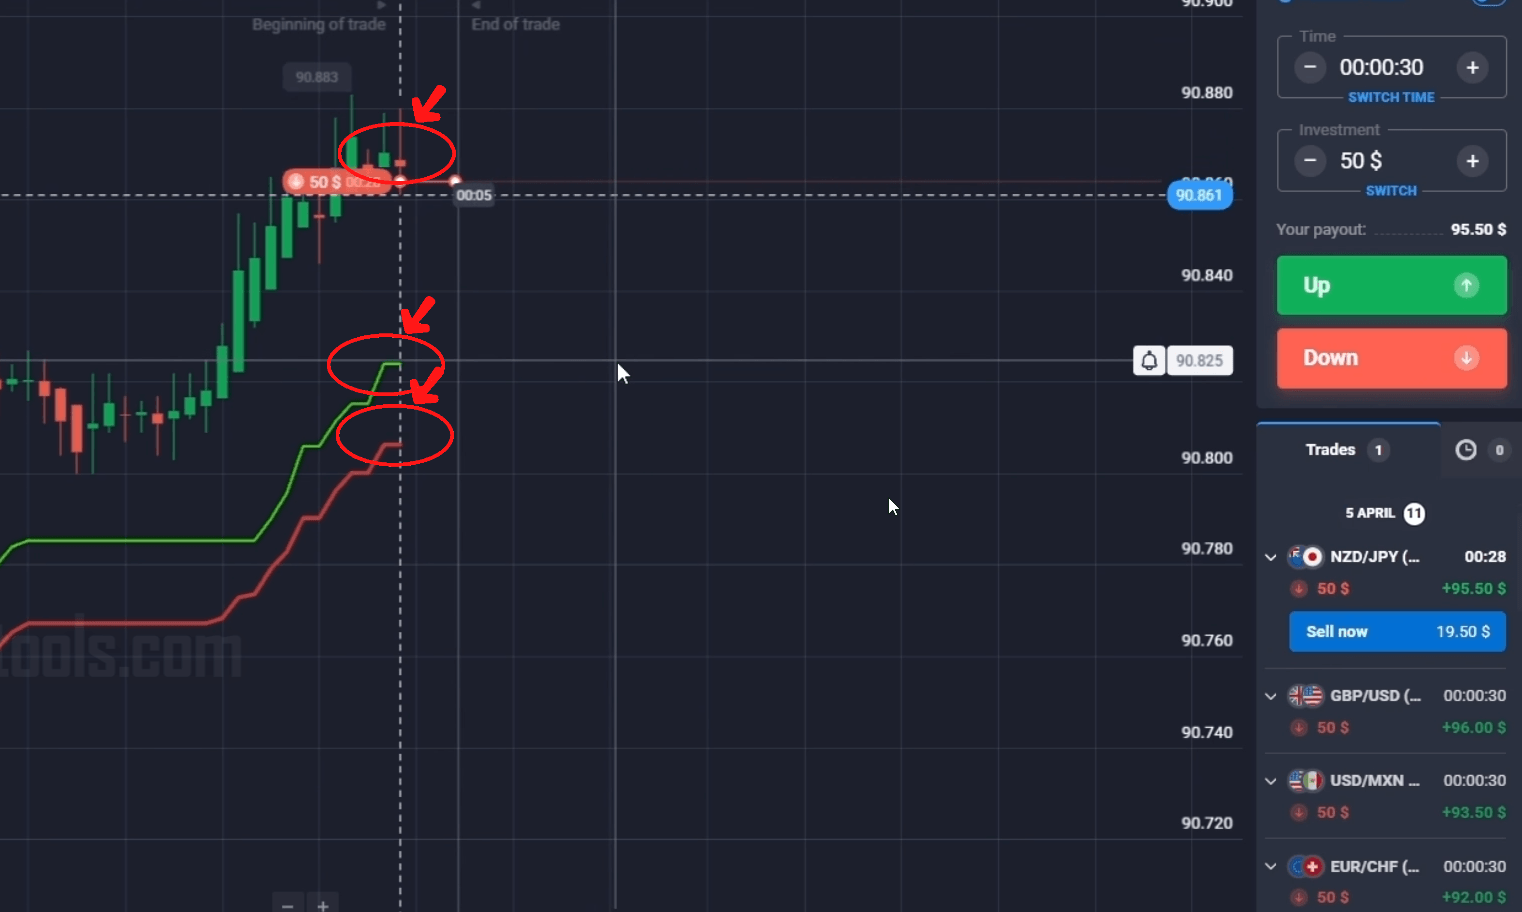
Once both Supertrend indicators are on your chart, the strategy becomes entirely visual. You are watching for one specific condition: both the green and the red lines running close together and flowing in the same direction.
This is what traders call a convergence zone. When the two lines align and ride side by side — whether trending up or trending down — it tells you that both timeframes of the Supertrend agree on the direction of the trend. Price has been carried along by strong momentum, and a turning point is approaching.
- Upward convergence: Both red and green lines slope upward together. Price has been in a strong rally. Watch for a reversal candle at the top of that move to signal a downtrade.
- Downward convergence: Both lines flow smoothly downward together. A confident downtrend is in progress. Enter a sell trade in the direction of the trend, or wait for confirmation of the next continuation move.
The moment to act is right at the convergence point — when the trend has fully committed and a reversal candle or breakout pattern appears. That is your entry trigger.
Trade Example 1 — NZDJPY Downtrade
On the NZDJPY chart, both the green and the red Supertrend lines were running almost level with each other, with a smooth, flowing upward momentum visible across the price action. The two lines had converged, and price had been riding that strong upward trend for several candles.
At the peak of that move, a reversal pattern formed right at the convergence zone — the exact signal this strategy is built to catch. A downtrade was placed on NZDJPY, and the trade closed as a winner.
This is the strategy working exactly as designed: both indicators agree the trend is exhausted, a reversal candle appears at the top, and the trade captures the turning point.
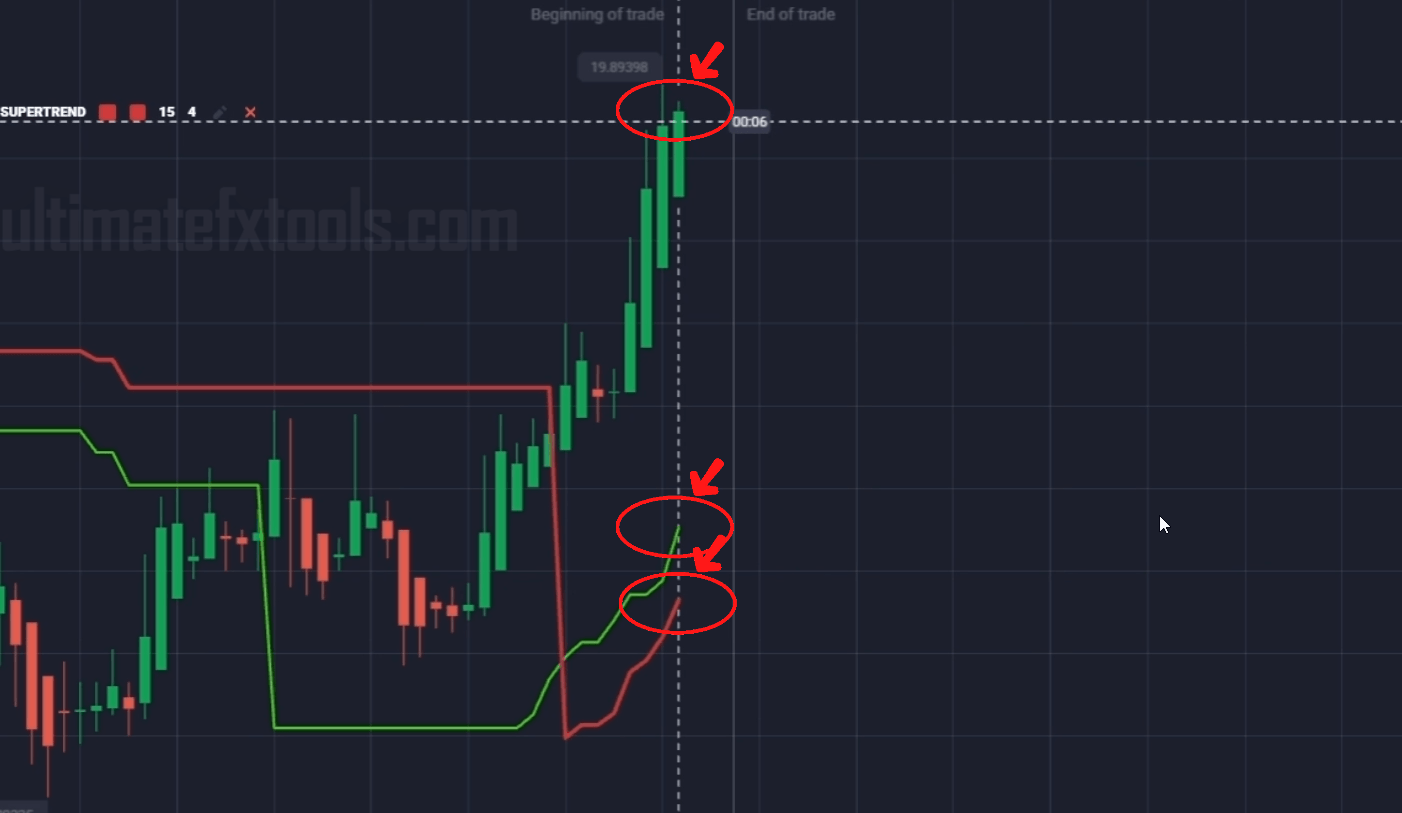
Trade Example 2 — Downtrend Continuation on 10-Second Chart
The second trade demonstrates the strategy's ability to trade with the trend rather than against it. Using a 10-second candle chart with a 30-second trade duration, both the green and the red Supertrend lines had been flowing smoothly downward — a clean, confident downtrend playing out in real time.
With both indicators fully aligned in the same downward direction, a sell trade was entered. The result: a winning trade in the direction of the trend. No complex analysis required — just two lines, both pointing down, both agreeing on momentum.
Trade Example 3 — EuroGBP: Handling a Break-Even Result
Not every setup resolves cleanly, and this is where risk management matters. On EuroGBP, both the green and red Supertrend lines were moving upward together — momentum had been building on the pair. At the peak of that upward move, a clear turning point formed, with a red candle beginning to push back down from the high.
A downtrade was placed. However, price failed to commit cleanly in either direction, and the trade resulted in a scratch — break-even at zero.
This is an important lesson: a break-even outcome is always preferable to a loss. The setup was valid, the signal was there, but price chose indecision. In short-term binary options trading, this happens. The right response is to accept the result and move on — not to revenge trade or force the next entry.
Strategy Settings Summary
- Chart timeframe: 10-second candles
- Trade duration: 30 seconds
- Supertrend 1: Period 15, Multiplier 4 — both lines colored red
- Supertrend 2: Period 8, Multiplier 3 — both lines colored green
- Entry signal: Both lines converging and flowing in the same direction, followed by a reversal candle or breakout pattern
- Best pairs: Look for pairs where momentum is clearly established — NZDJPY, EuroGBP, and similar liquid forex pairs work well
Why Two Supertrend Lines Work Better Than One
A single Supertrend indicator is a useful tool, but it can generate false signals when used alone on very short-term charts. Adding a second Supertrend with different parameters solves this problem by requiring both timeframes to agree before you consider an entry.
When the fast (green) and slow (red) Supertrends are aligned and converging, you have dual confirmation of the prevailing trend. This dramatically reduces the number of low-quality setups you are exposed to, keeping your trades focused on the highest-probability convergence zones.
The colour difference (red vs. green) also makes chart reading instant and intuitive — you can see at a glance whether the two indicators are in agreement or diverging, without needing to decode settings menus or numerical outputs.
Risk Management Rules
- Only trade with money you can afford to lose. Binary options carry significant risk.
- Set a daily trade limit and stop once you have hit your target or your loss threshold.
- Do not chase losses by doubling positions impulsively — manage risk carefully on every trade.
- A break-even result is not a failure. Accept it and look for the next clean setup.
- Scan multiple currency pairs before committing — the best opportunities appear across different assets throughout the session.
Quotex Supertrend Double Hack — Final Thoughts
The Quotex Supertrend Double Hack is a minimal, high-clarity strategy that strips away noise and focuses your attention on the moments that matter most: when two momentum indicators converge and a reversal is imminent. With just two indicators, clear colour-coded lines, and a simple set of entry rules, it is accessible to traders at all experience levels.
Apply it on the 10-second chart, keep your trade durations at 30 seconds, and always respect your risk limits. The strategy handles the signal generation — discipline handles the rest.
Watch the full video walkthrough below for a real-time demonstration of every trade shown in this guide, including the winning NZDJPY downtrade, the trend-continuation sell, and the EuroGBP break-even result.
#QuotexStrategy #SupertrendHack #DoubleSupertrendQuotex #QuotexTrading2026 #BinaryOptionsStrategy #10SecondChart #TrendReversal #ForexTrading #ShortTermTrading #TradingIndicators #QuotexSignals
Unlock Indicator Settings